Bitcoin Power Law — Empirical Test Suite

80 tests and 20 simulations behind Bitcoin’s Price Power Law Decomposed — published as run, including the wrong turns. Full index and reproduction guide: README.

β = βA × (1 + 1/α)  ≈  3.0 × 1.83  ≈  5.5   |   measured 5.62 ± 0.21

The monetary program (the detour)
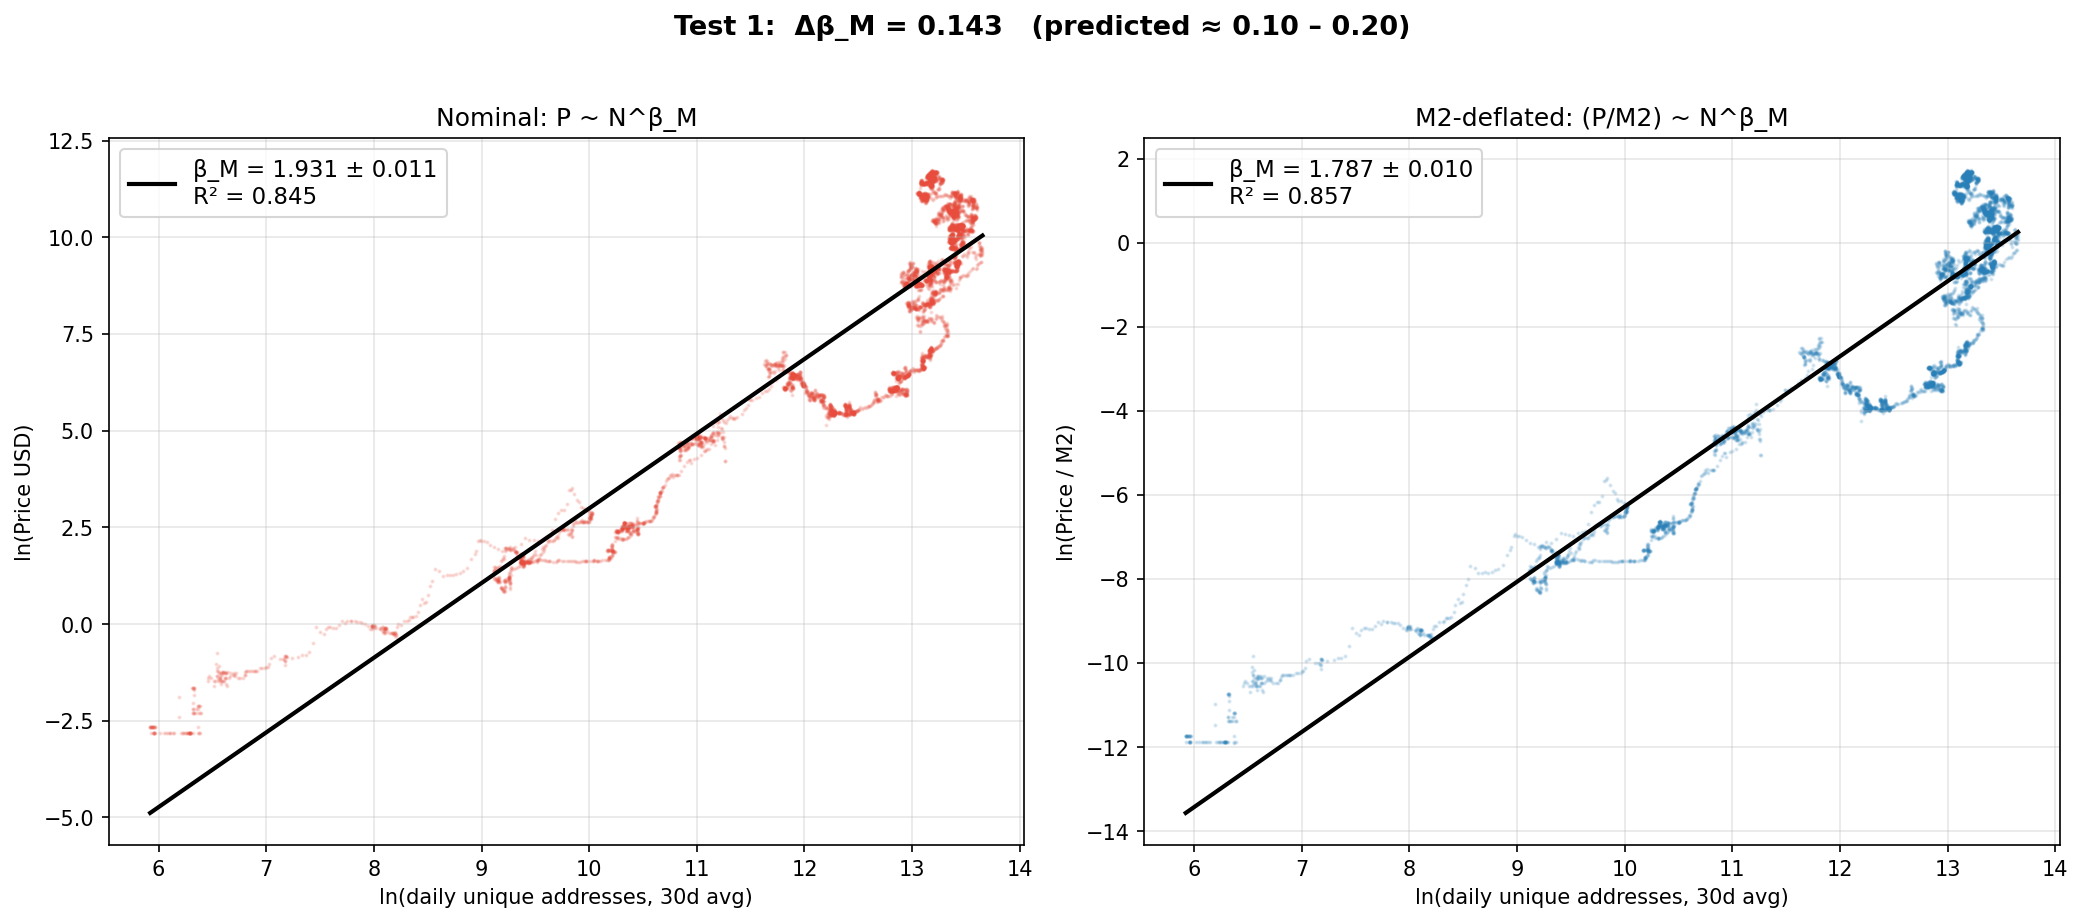
M2 deflation figure
Test 1 detour
M2 deflation
Does deflating by US M2 lower the exponent as predicted?
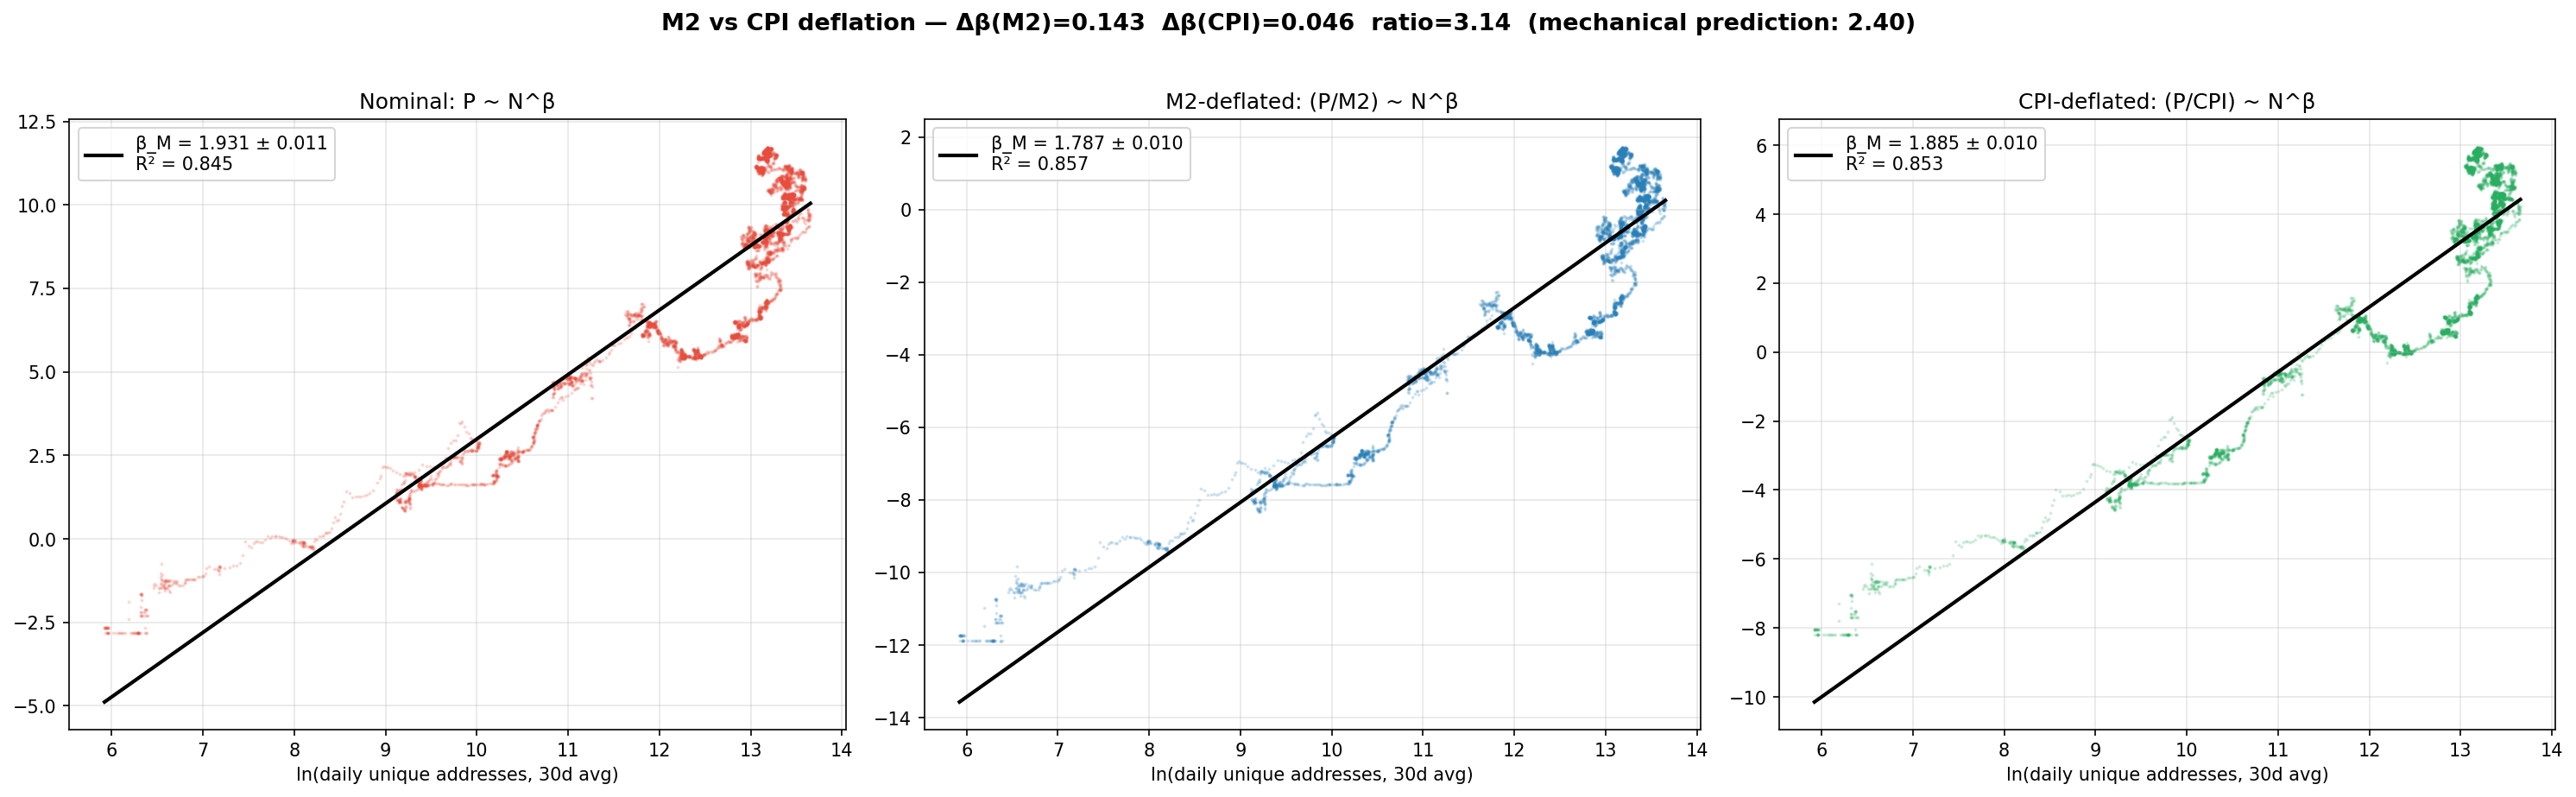
M2 vs CPI figure
Test 2 detour
M2 vs CPI
Money creation, not price inflation: ratio 3.14 vs 2.40 mechanical.
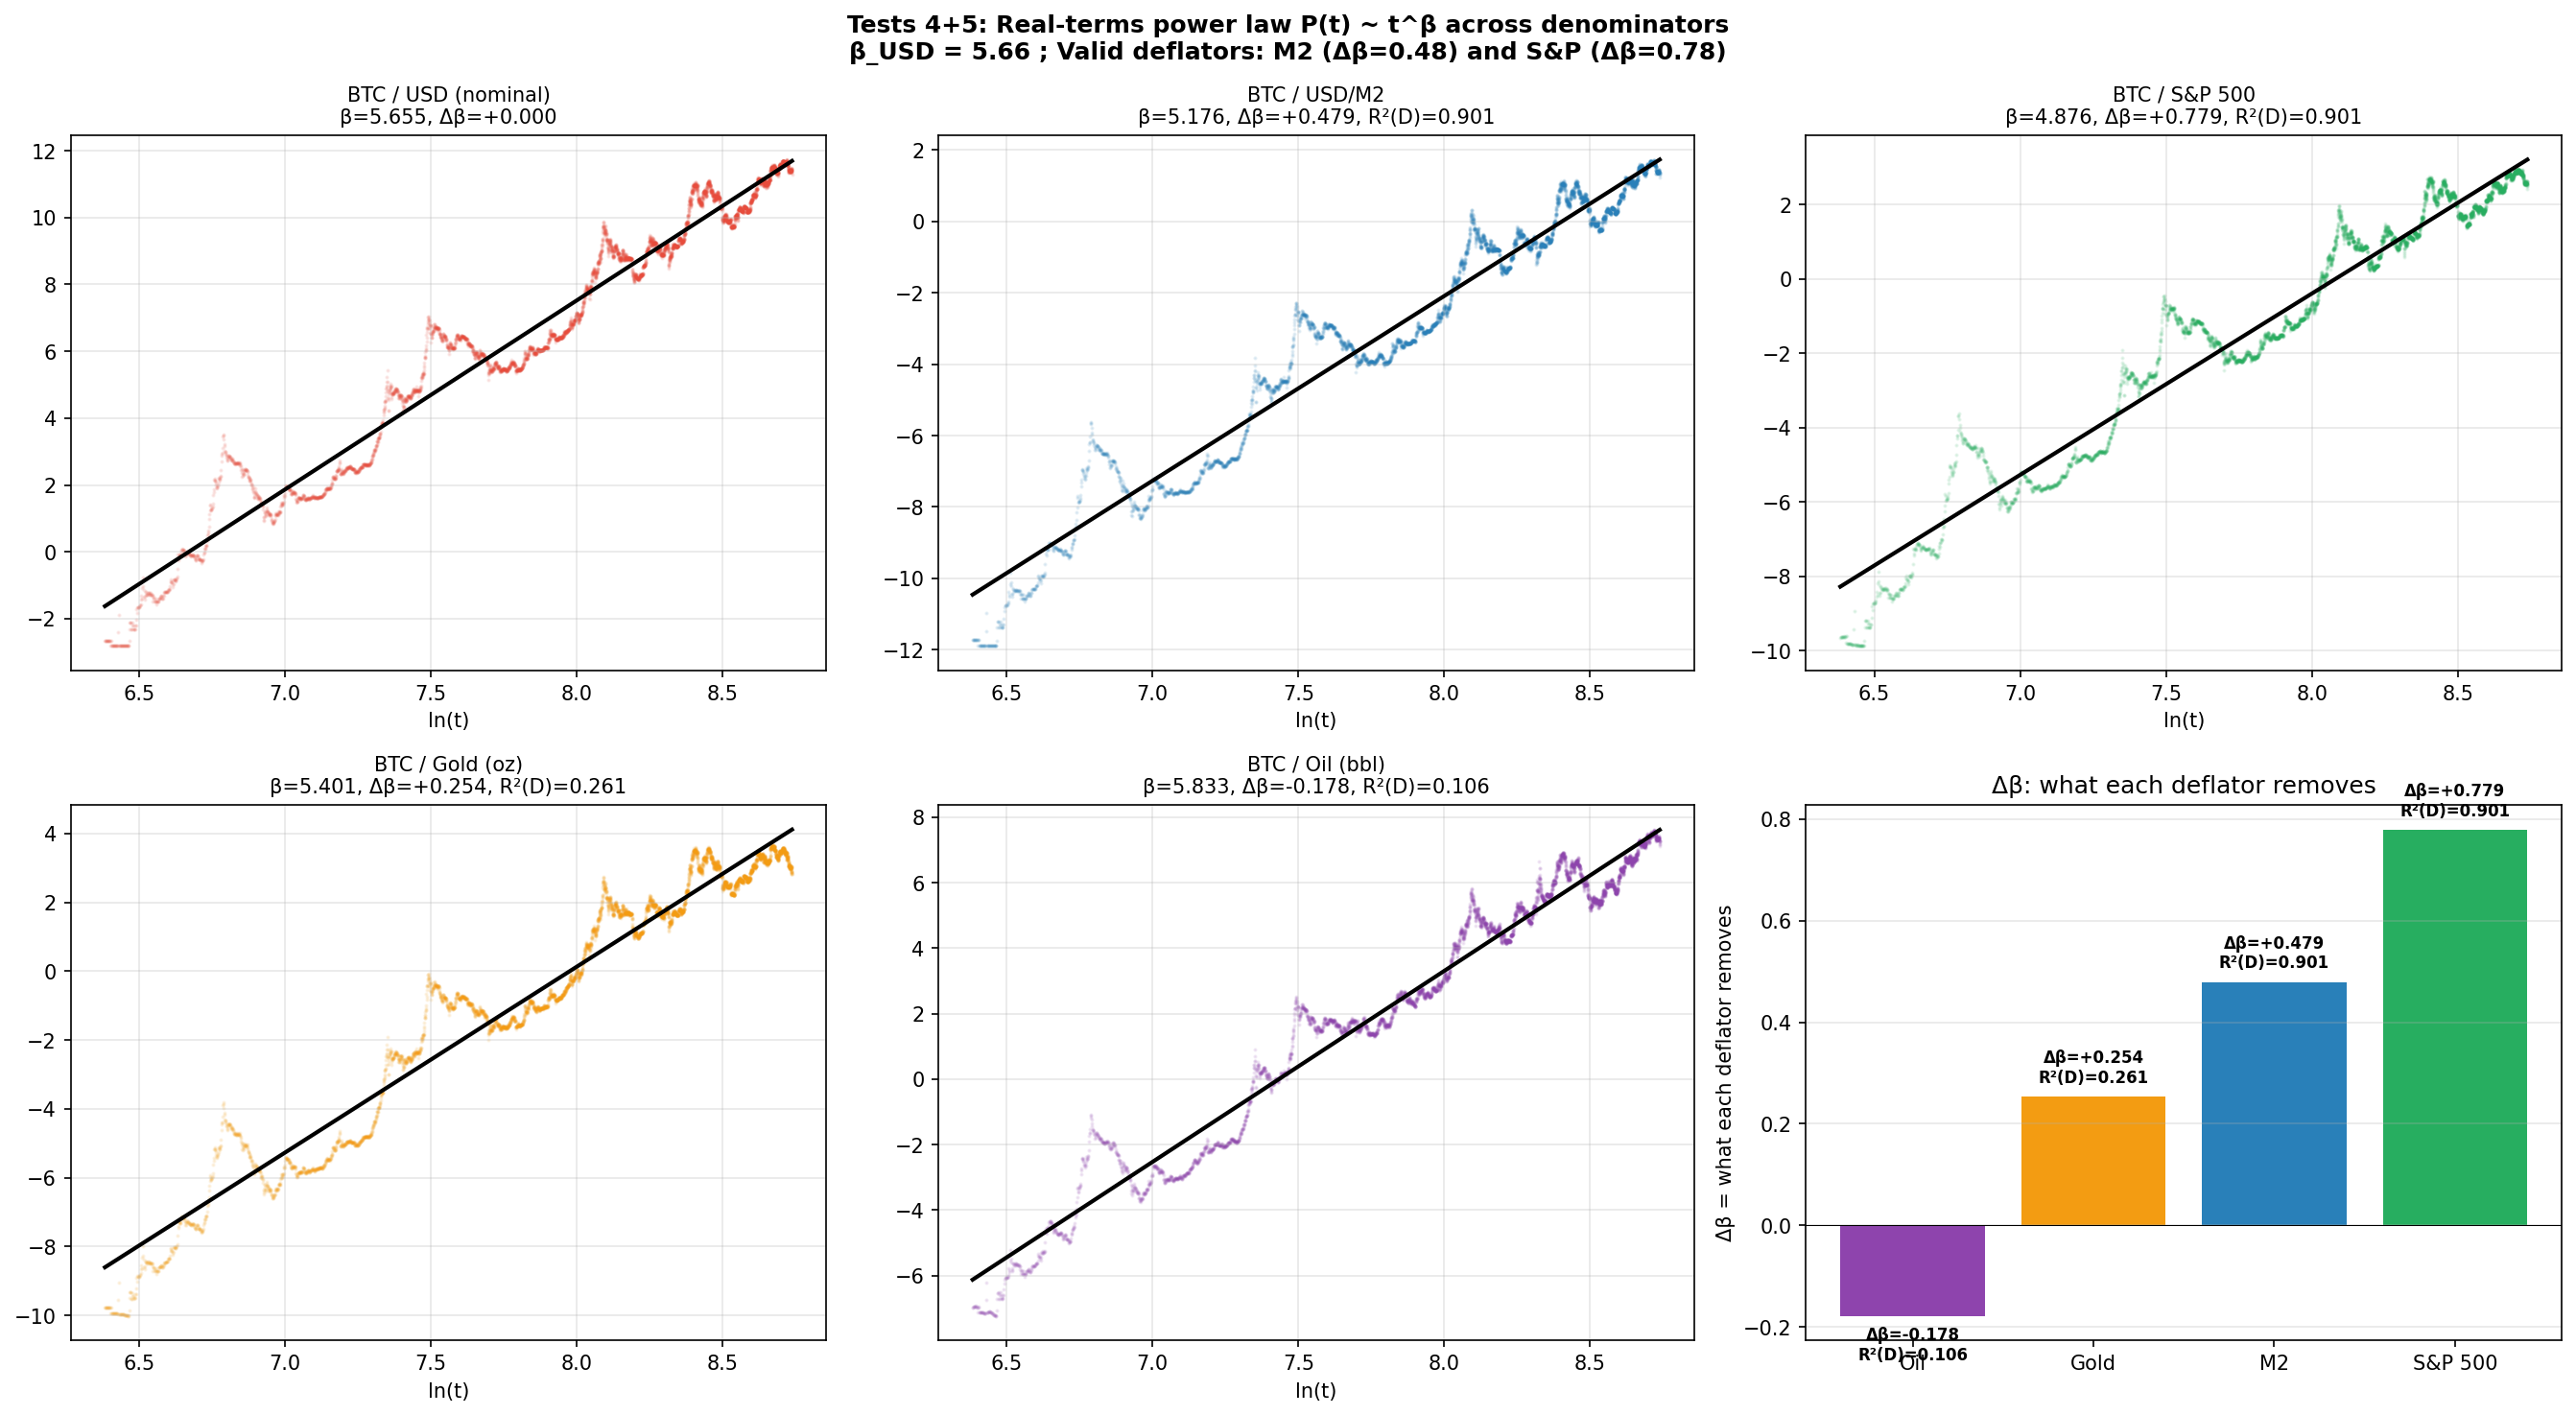
Deflator hierarchy figure
Test 4-5 detour
Deflator hierarchy
M2 and S&P are valid deflators; gold and oil are not.
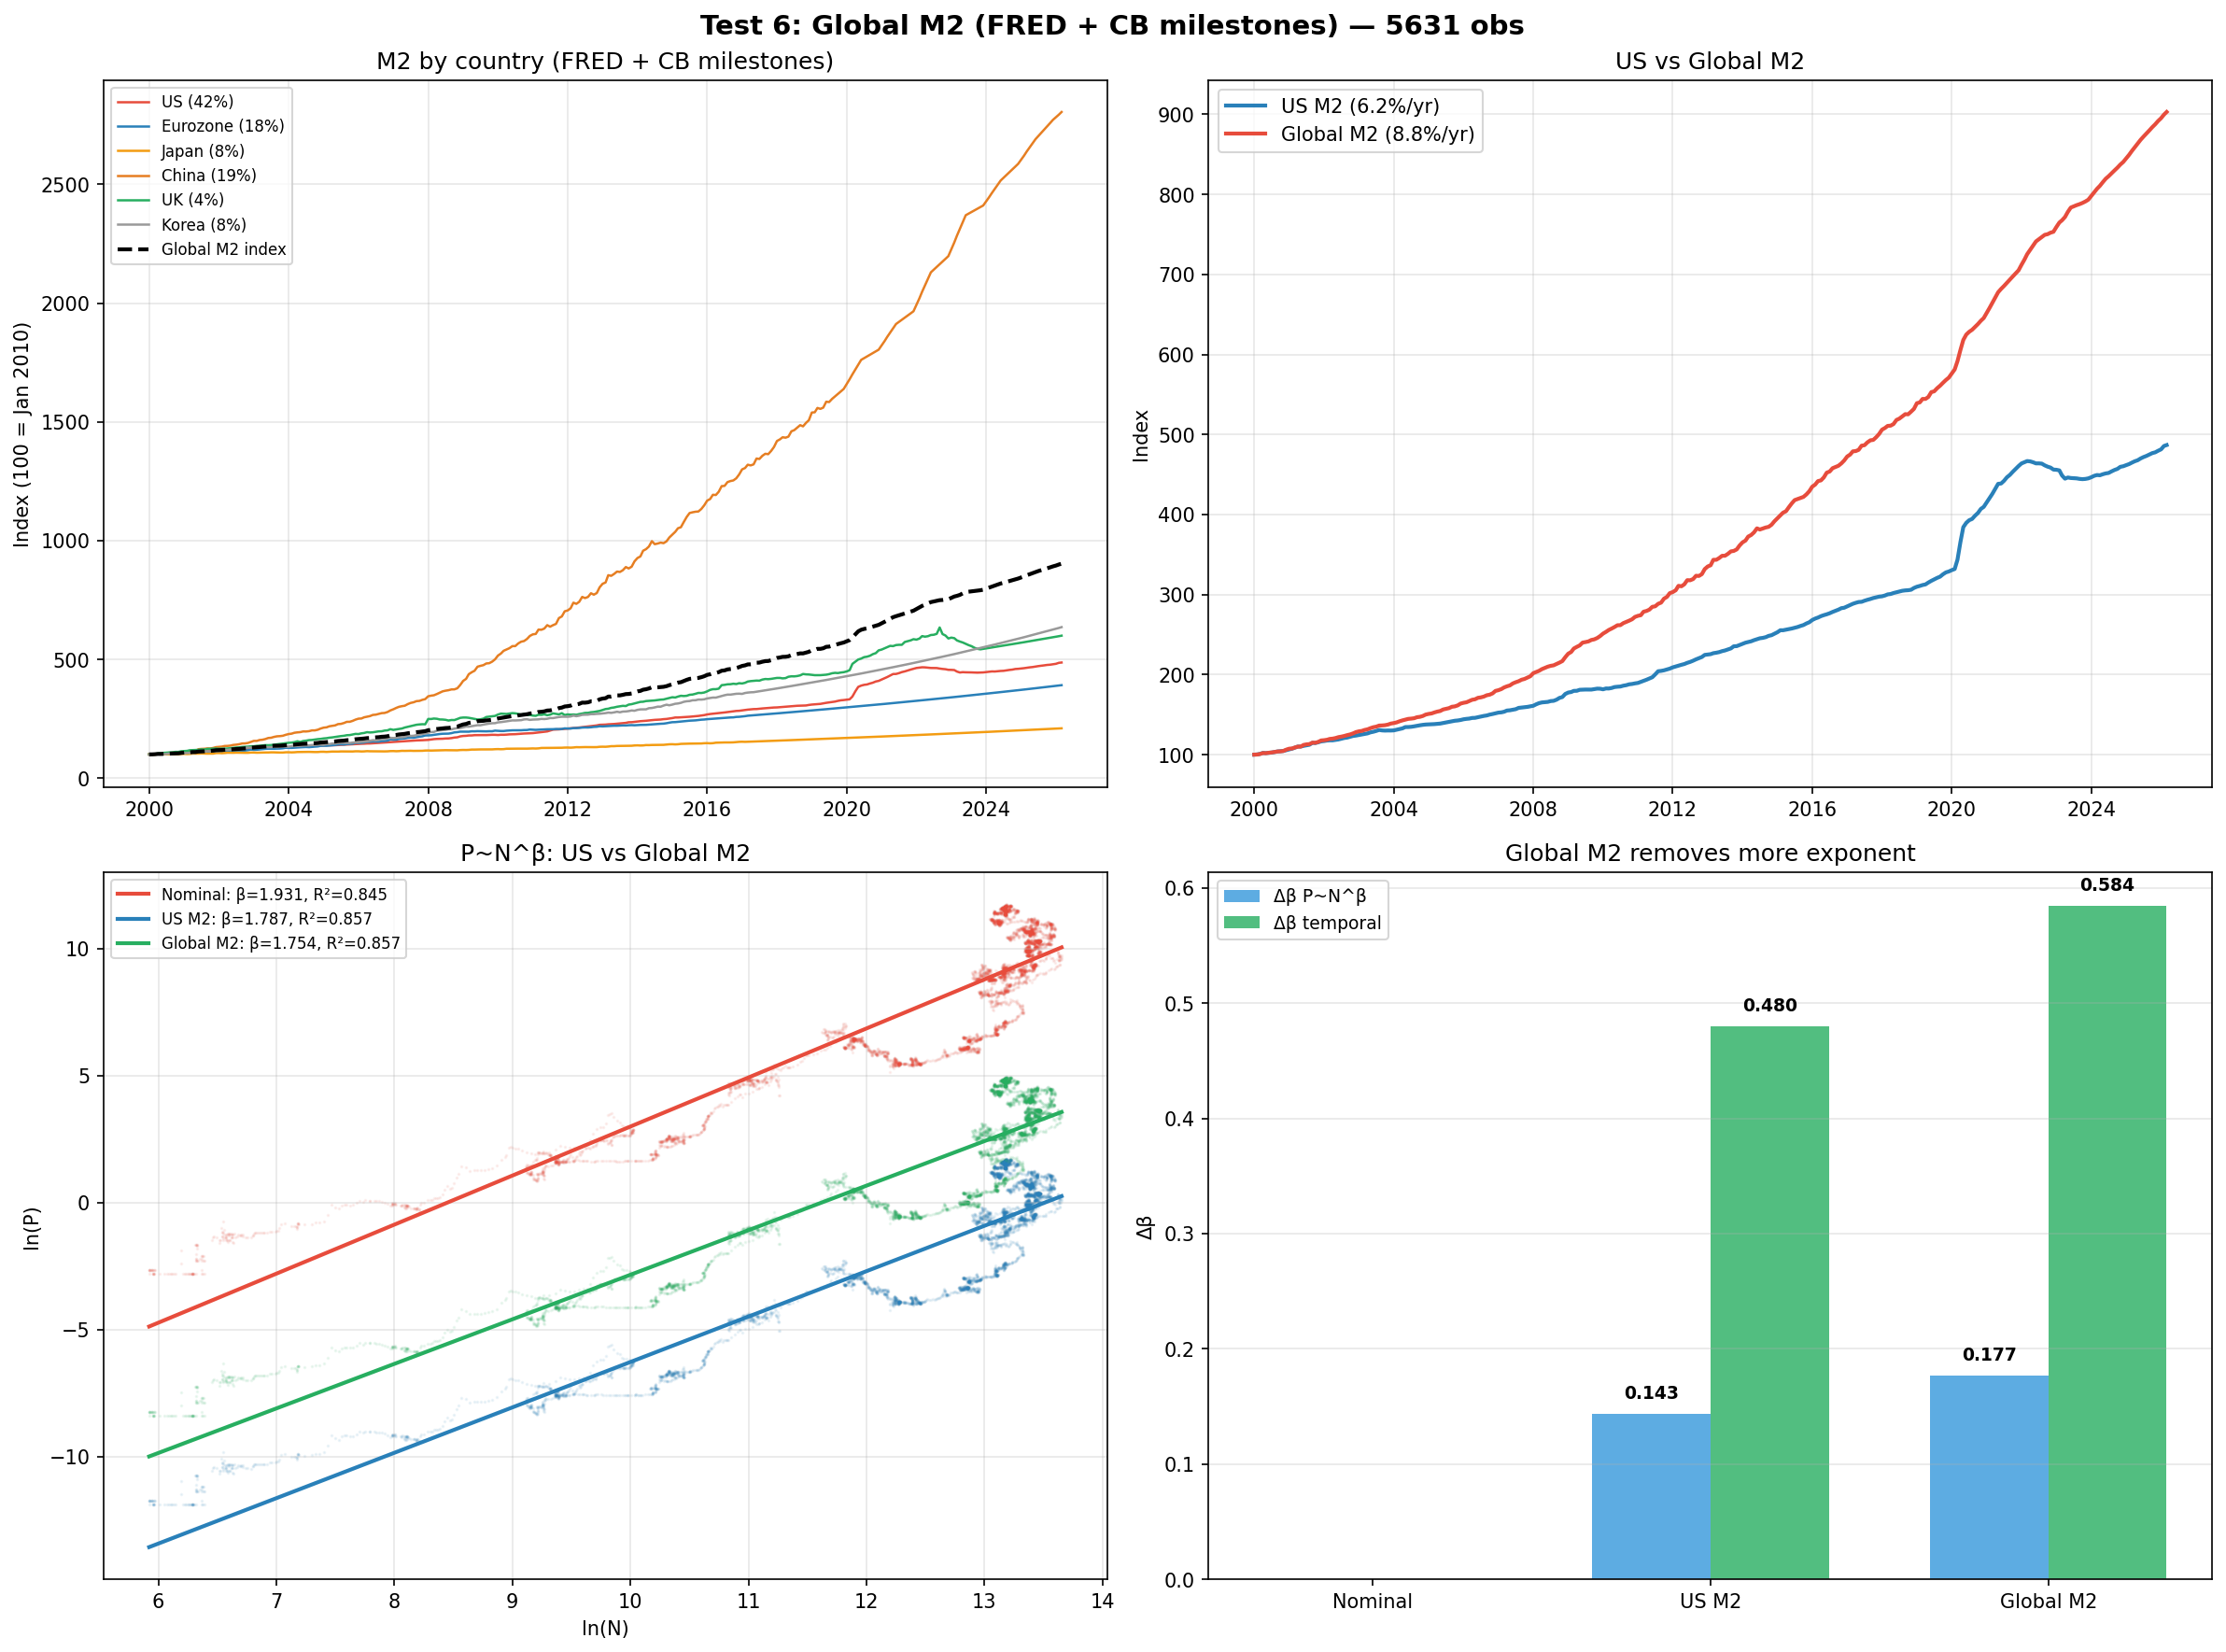
Global M2 figure
Test 6 detour
Global M2
A global M2 index removes 22-24% more exponent than US M2.
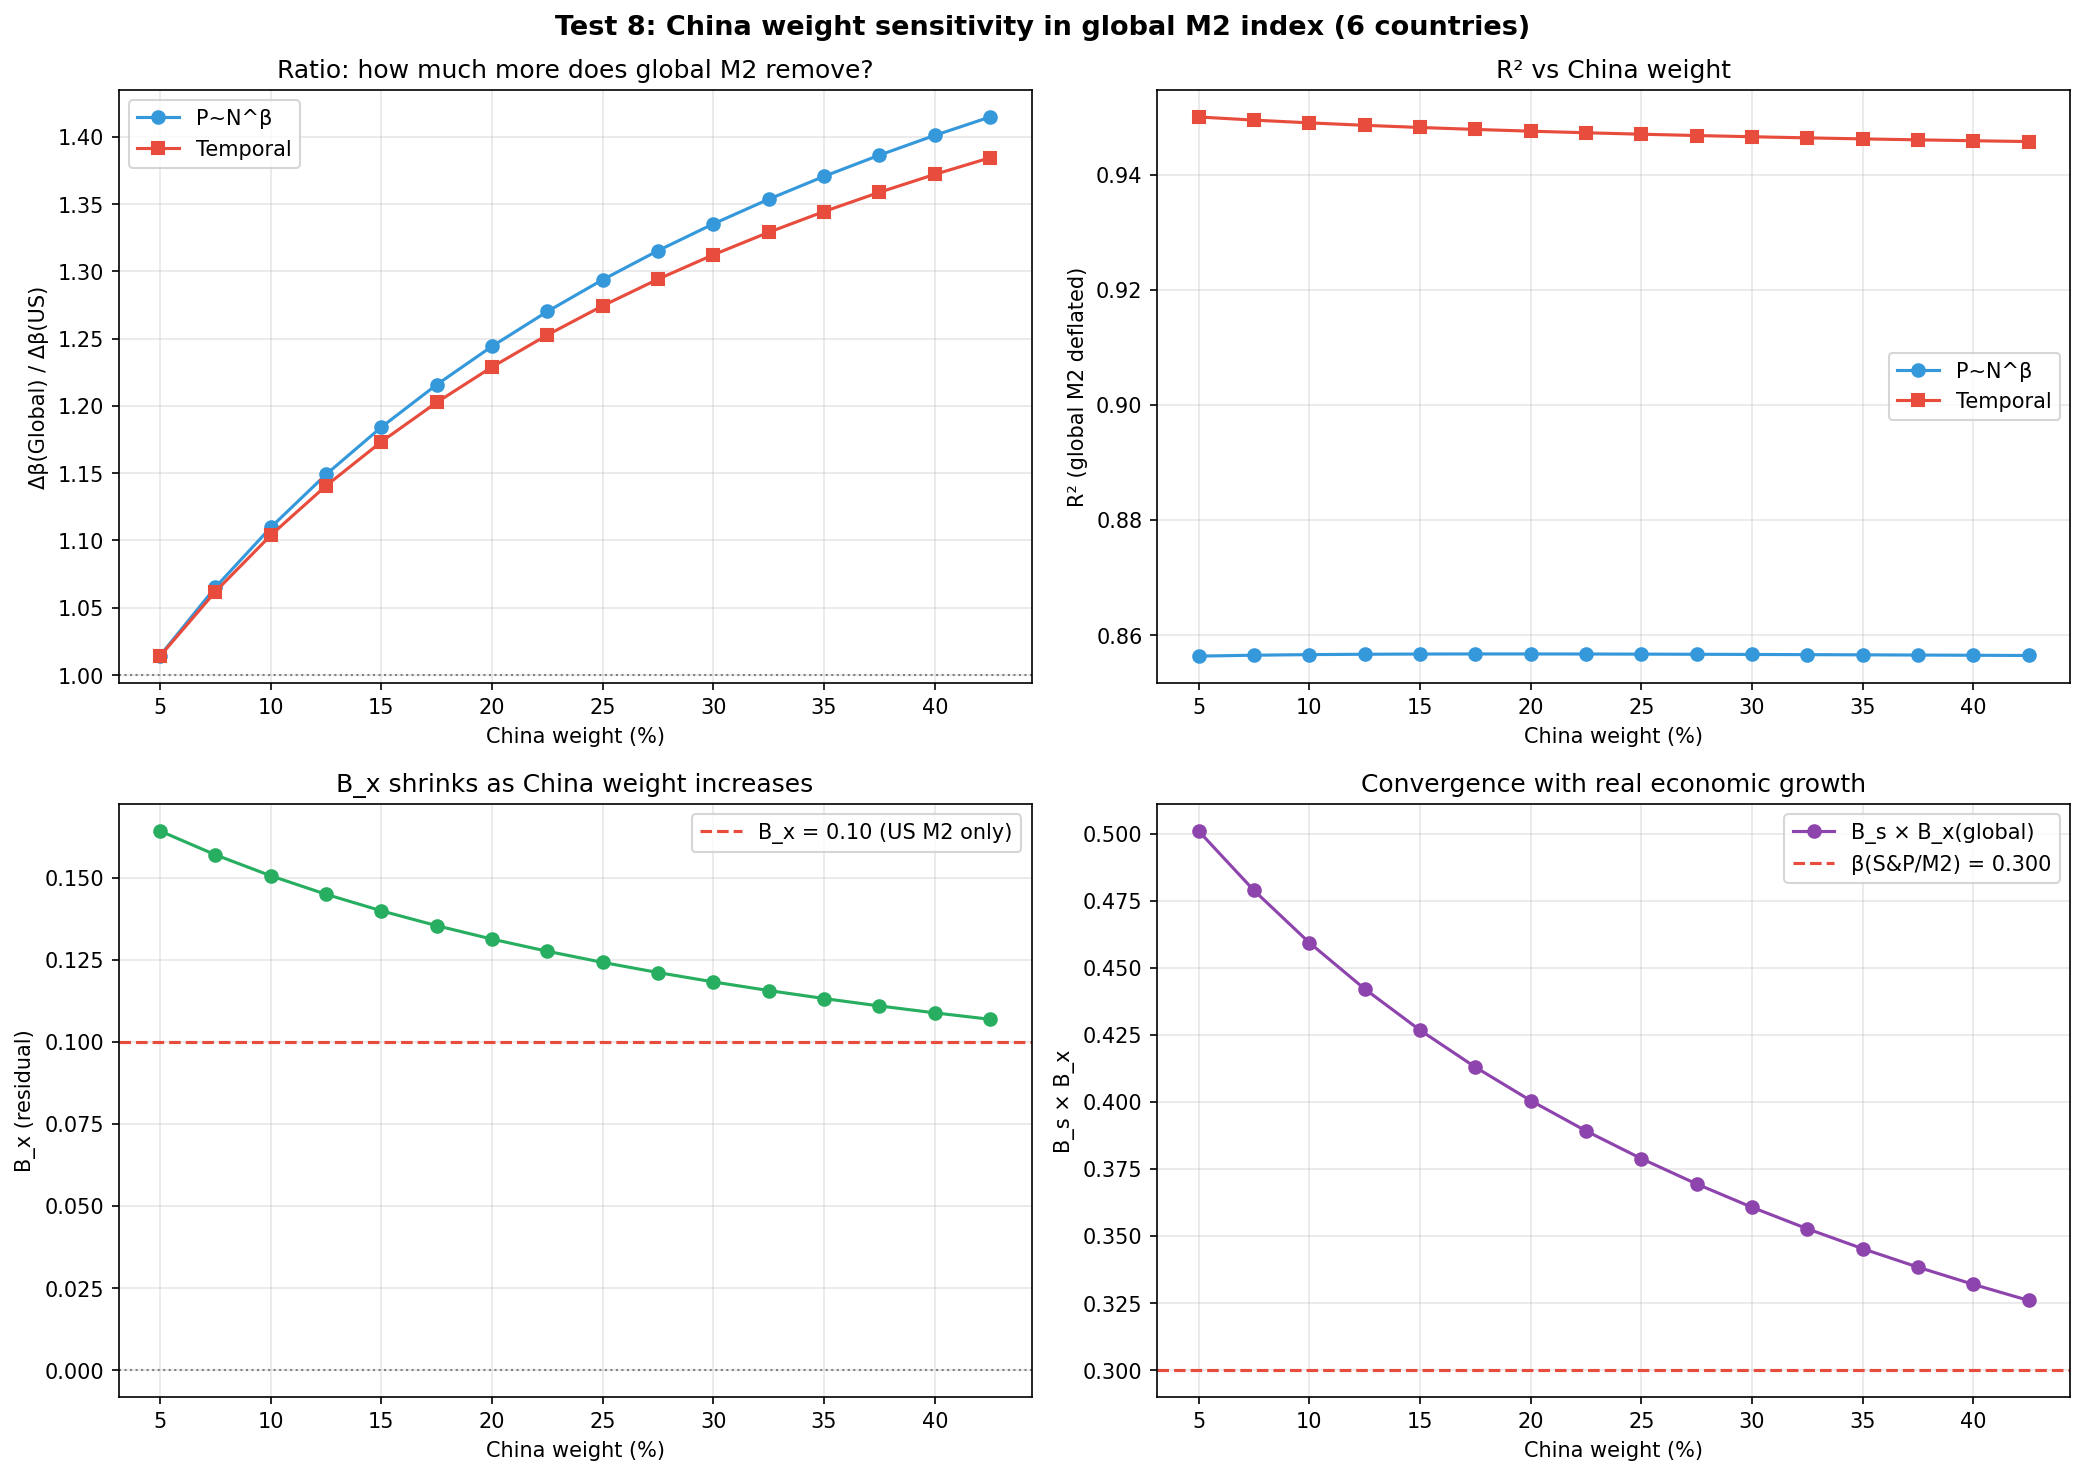
China weight sweep figure
Test 8 detour
China weight sweep
The global-M2 result holds for any China weight 5-42.5%.
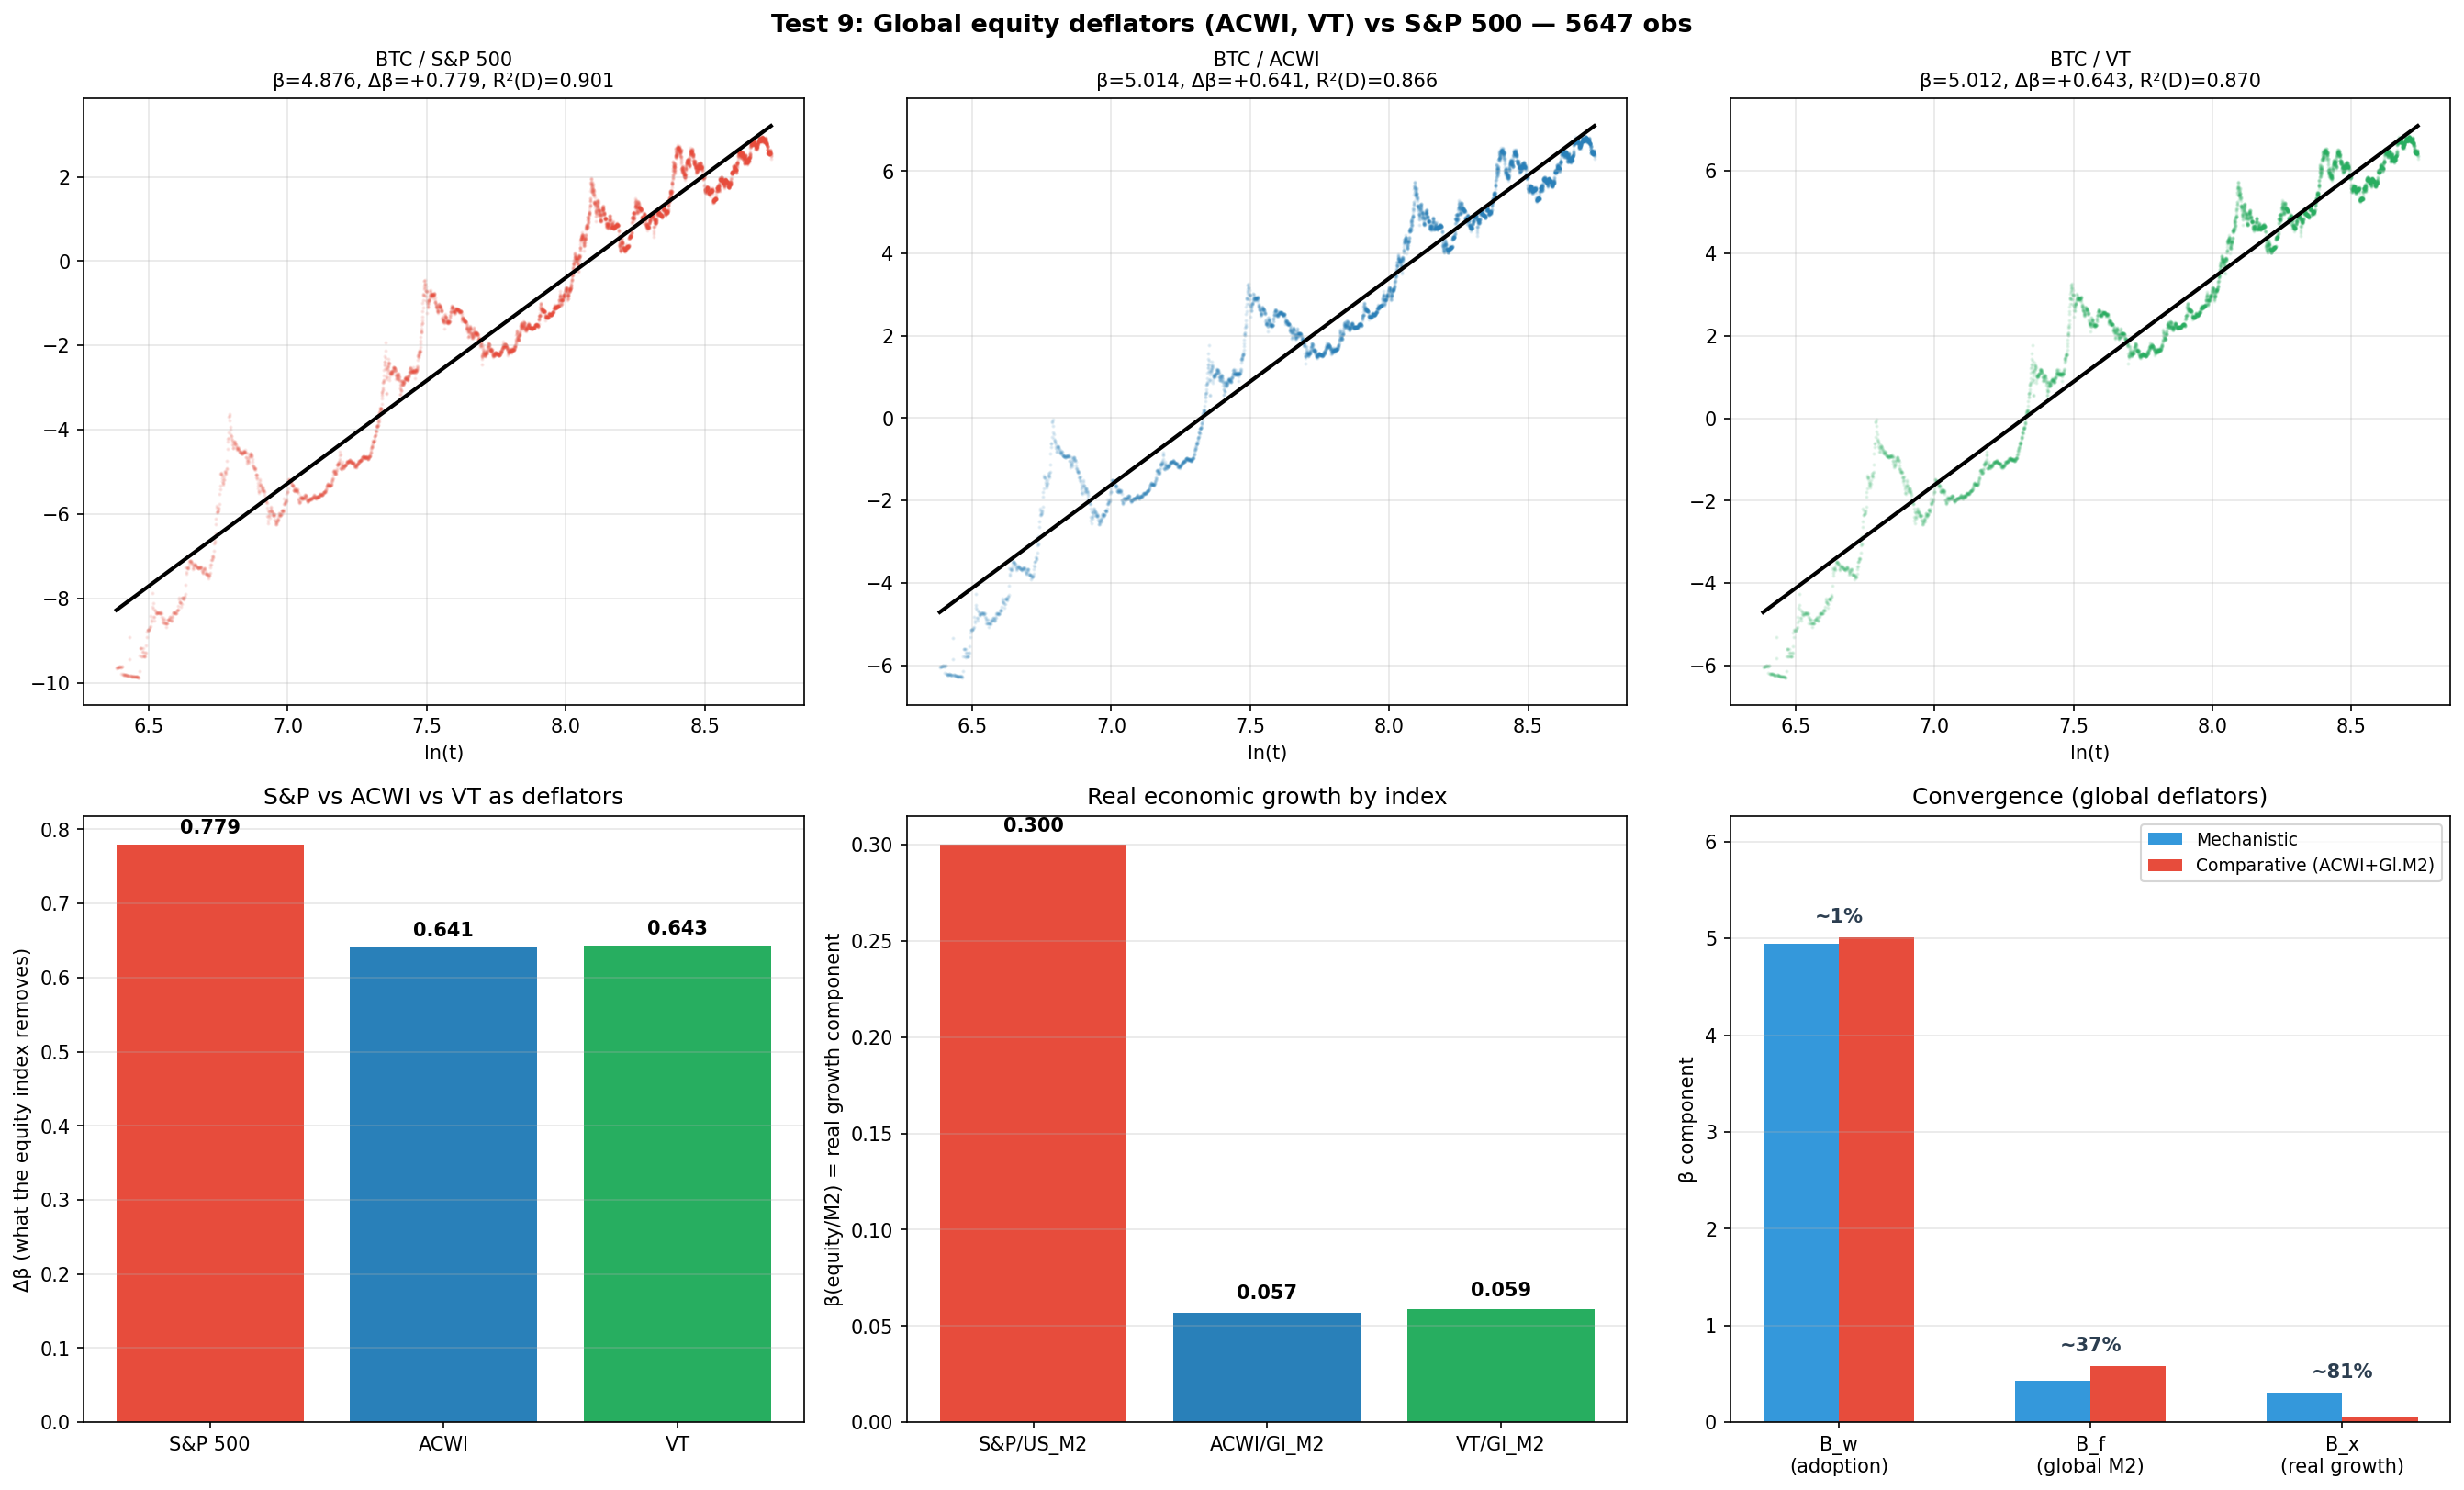
MSCI World deflator figure
Test 9 detour
MSCI World deflator
Global equities are not a better deflator than the S&P 500.
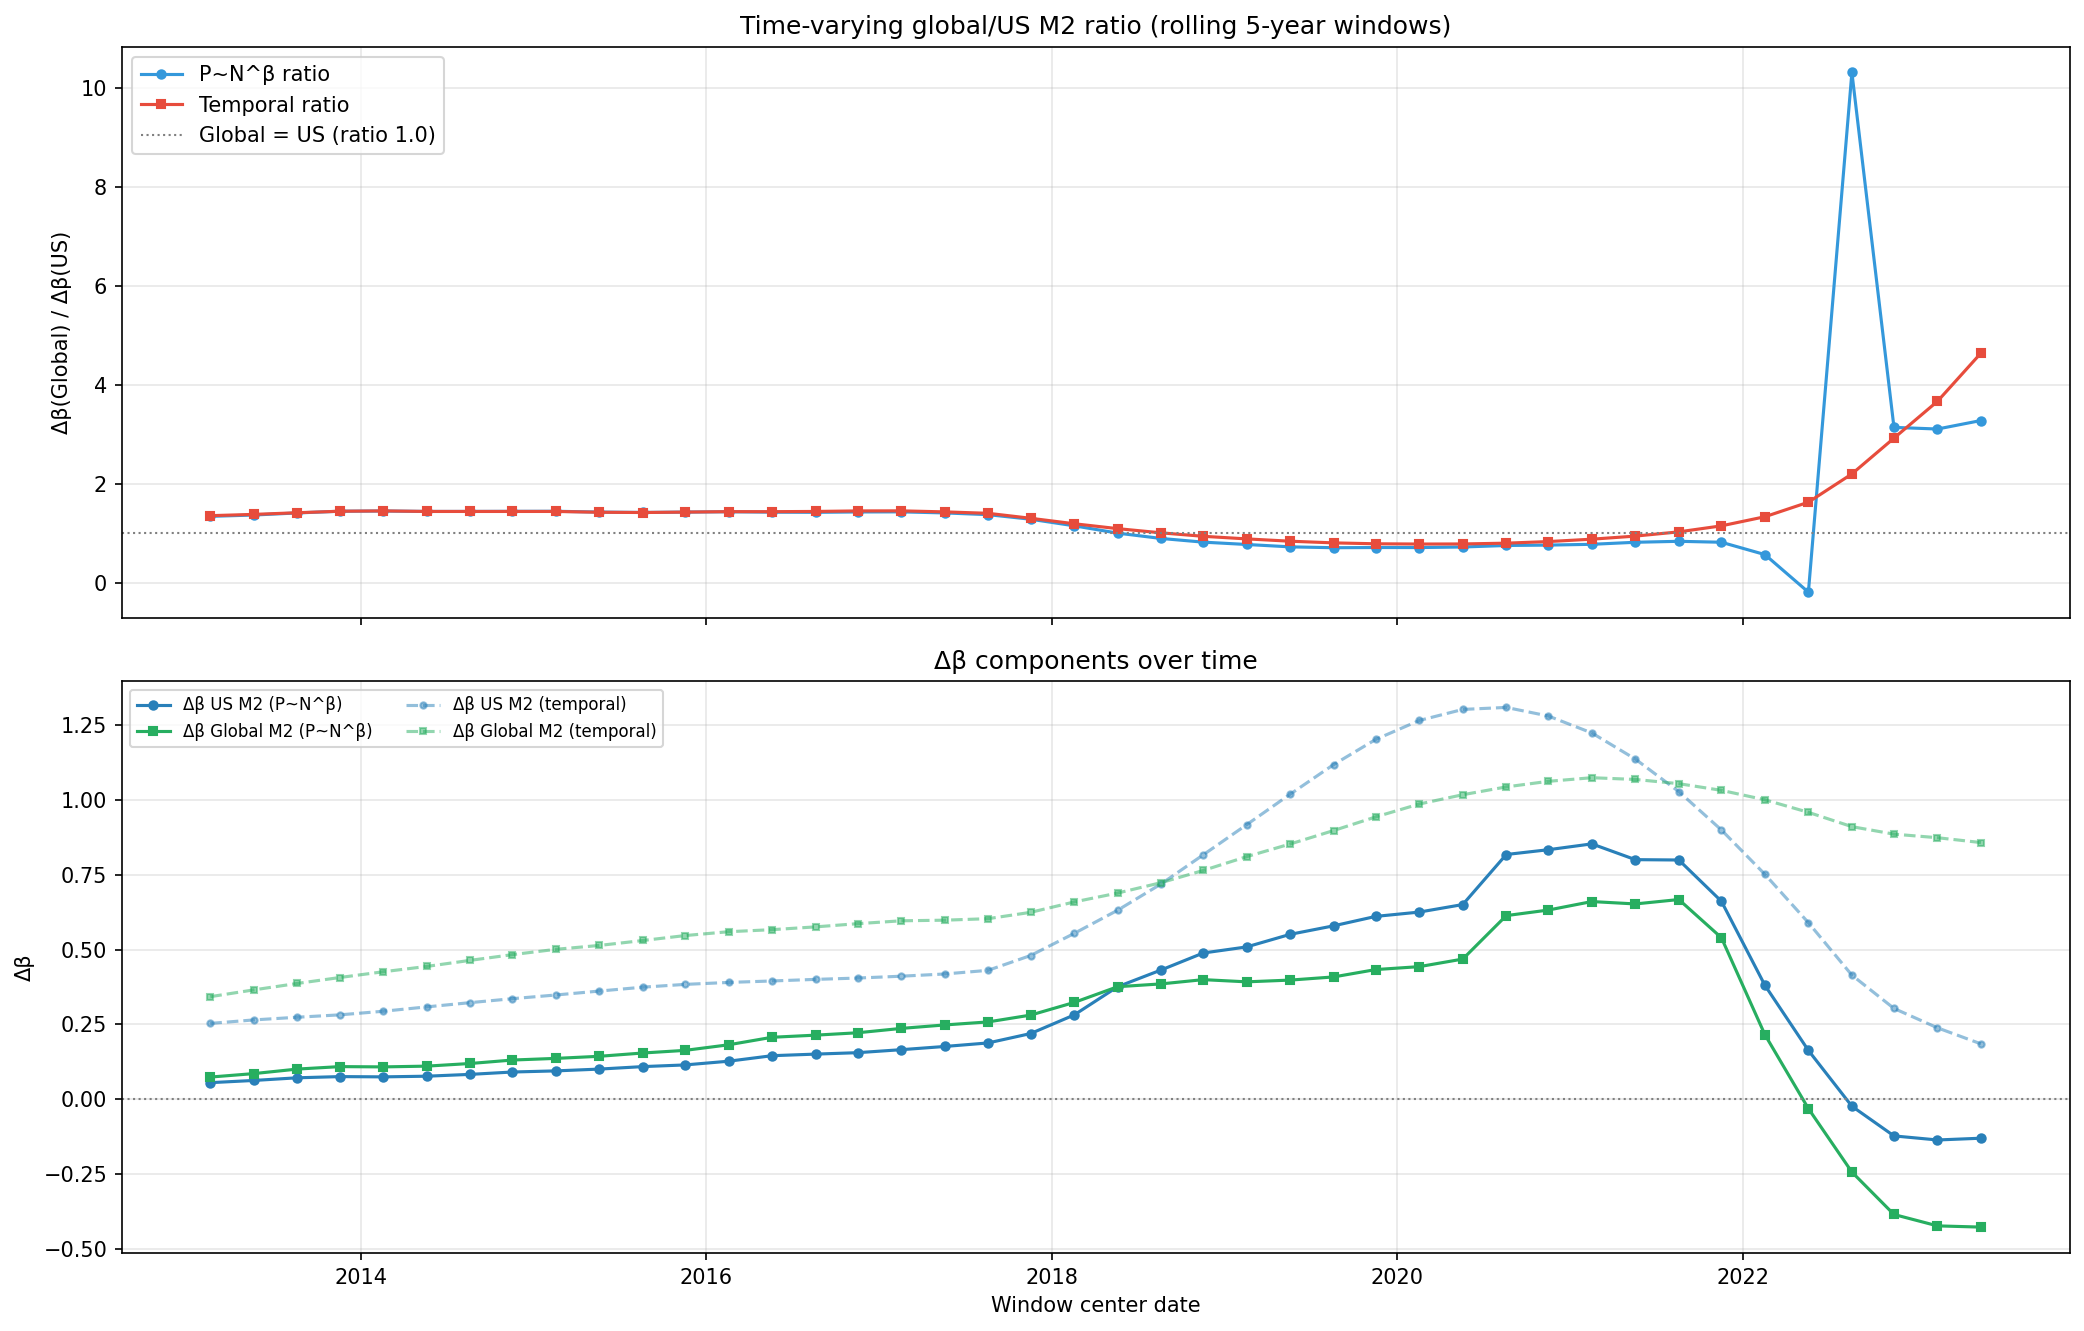
Rolling M2 ratio figure
Test 10 detour
Rolling M2 ratio
The global/US ratio is unstable in rolling windows.
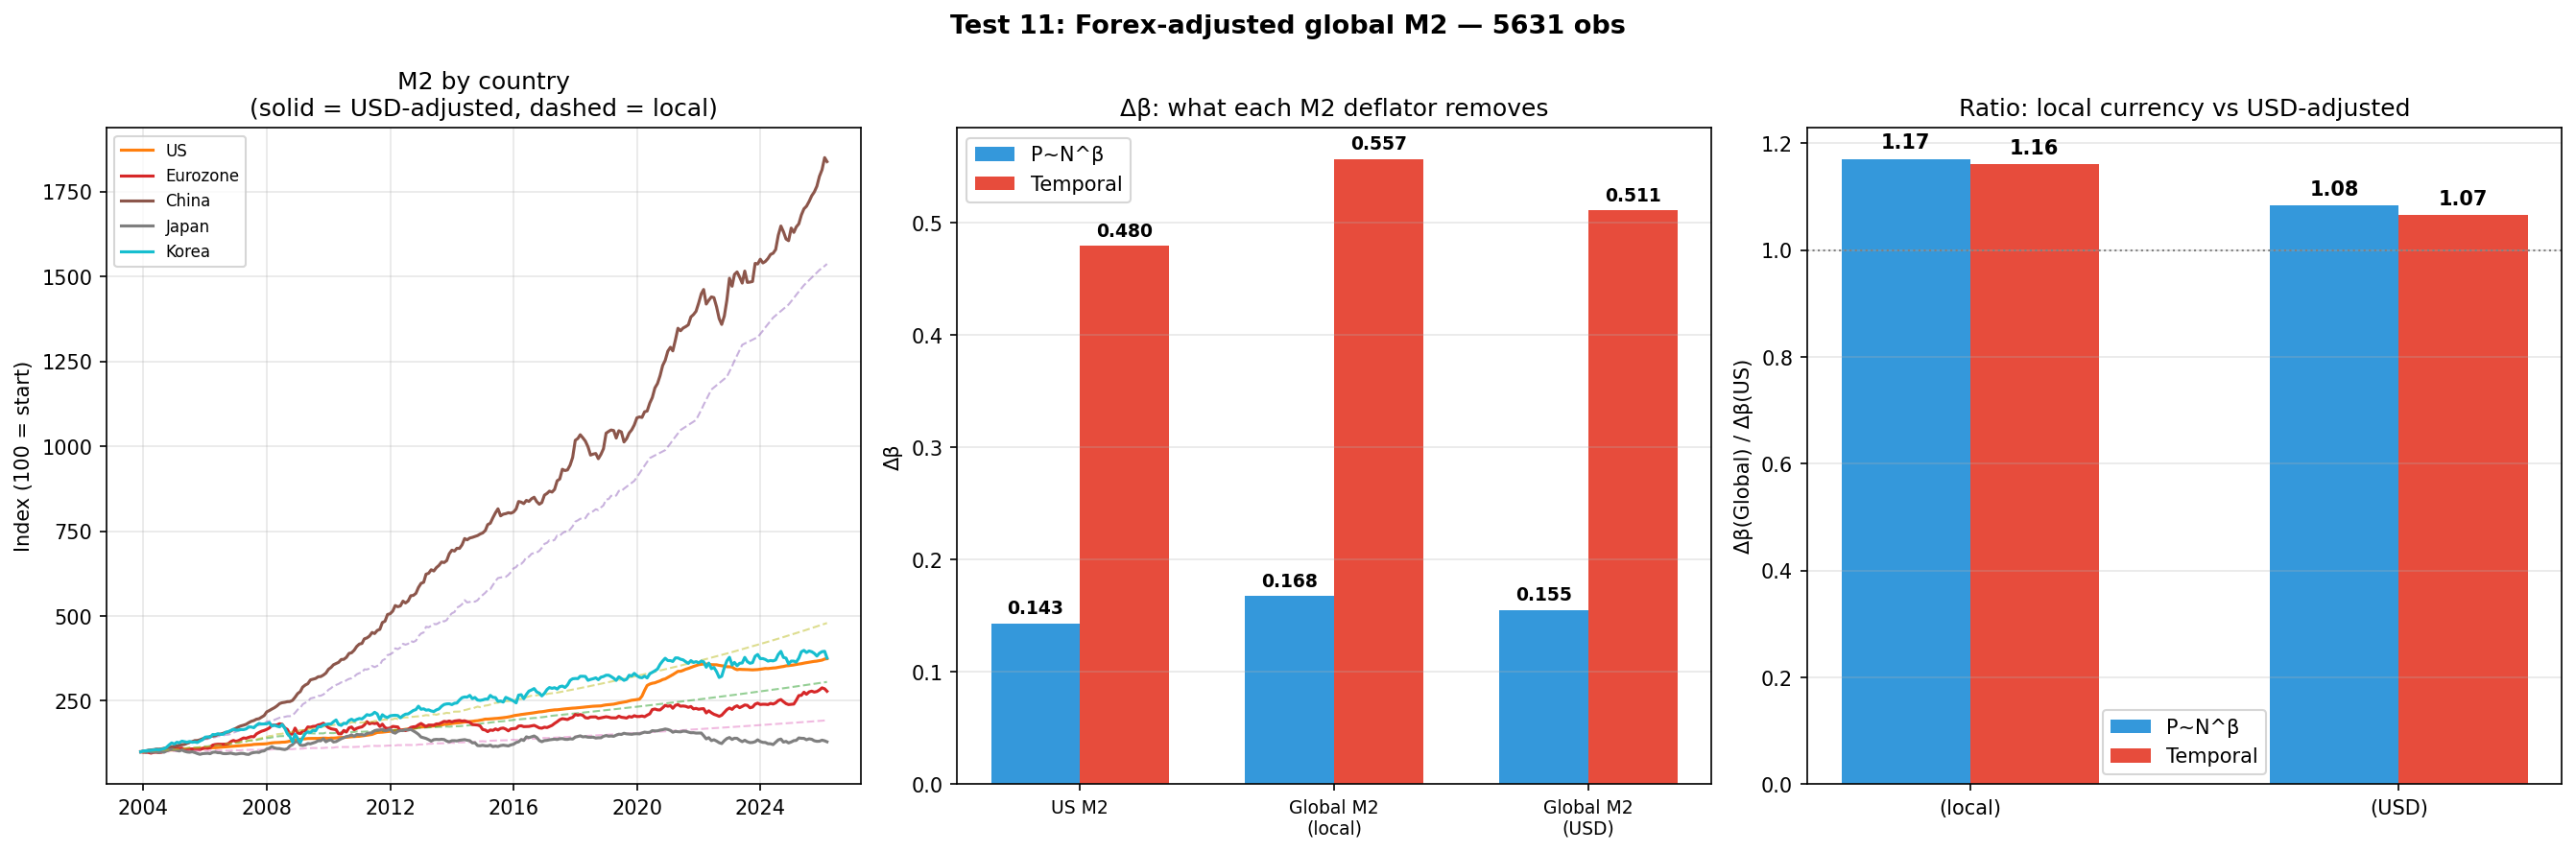
Forex-adjusted M2 figure
Test 11 detour
Forex-adjusted M2
The global-M2 advantage survives USD conversion (1.08-1.17).
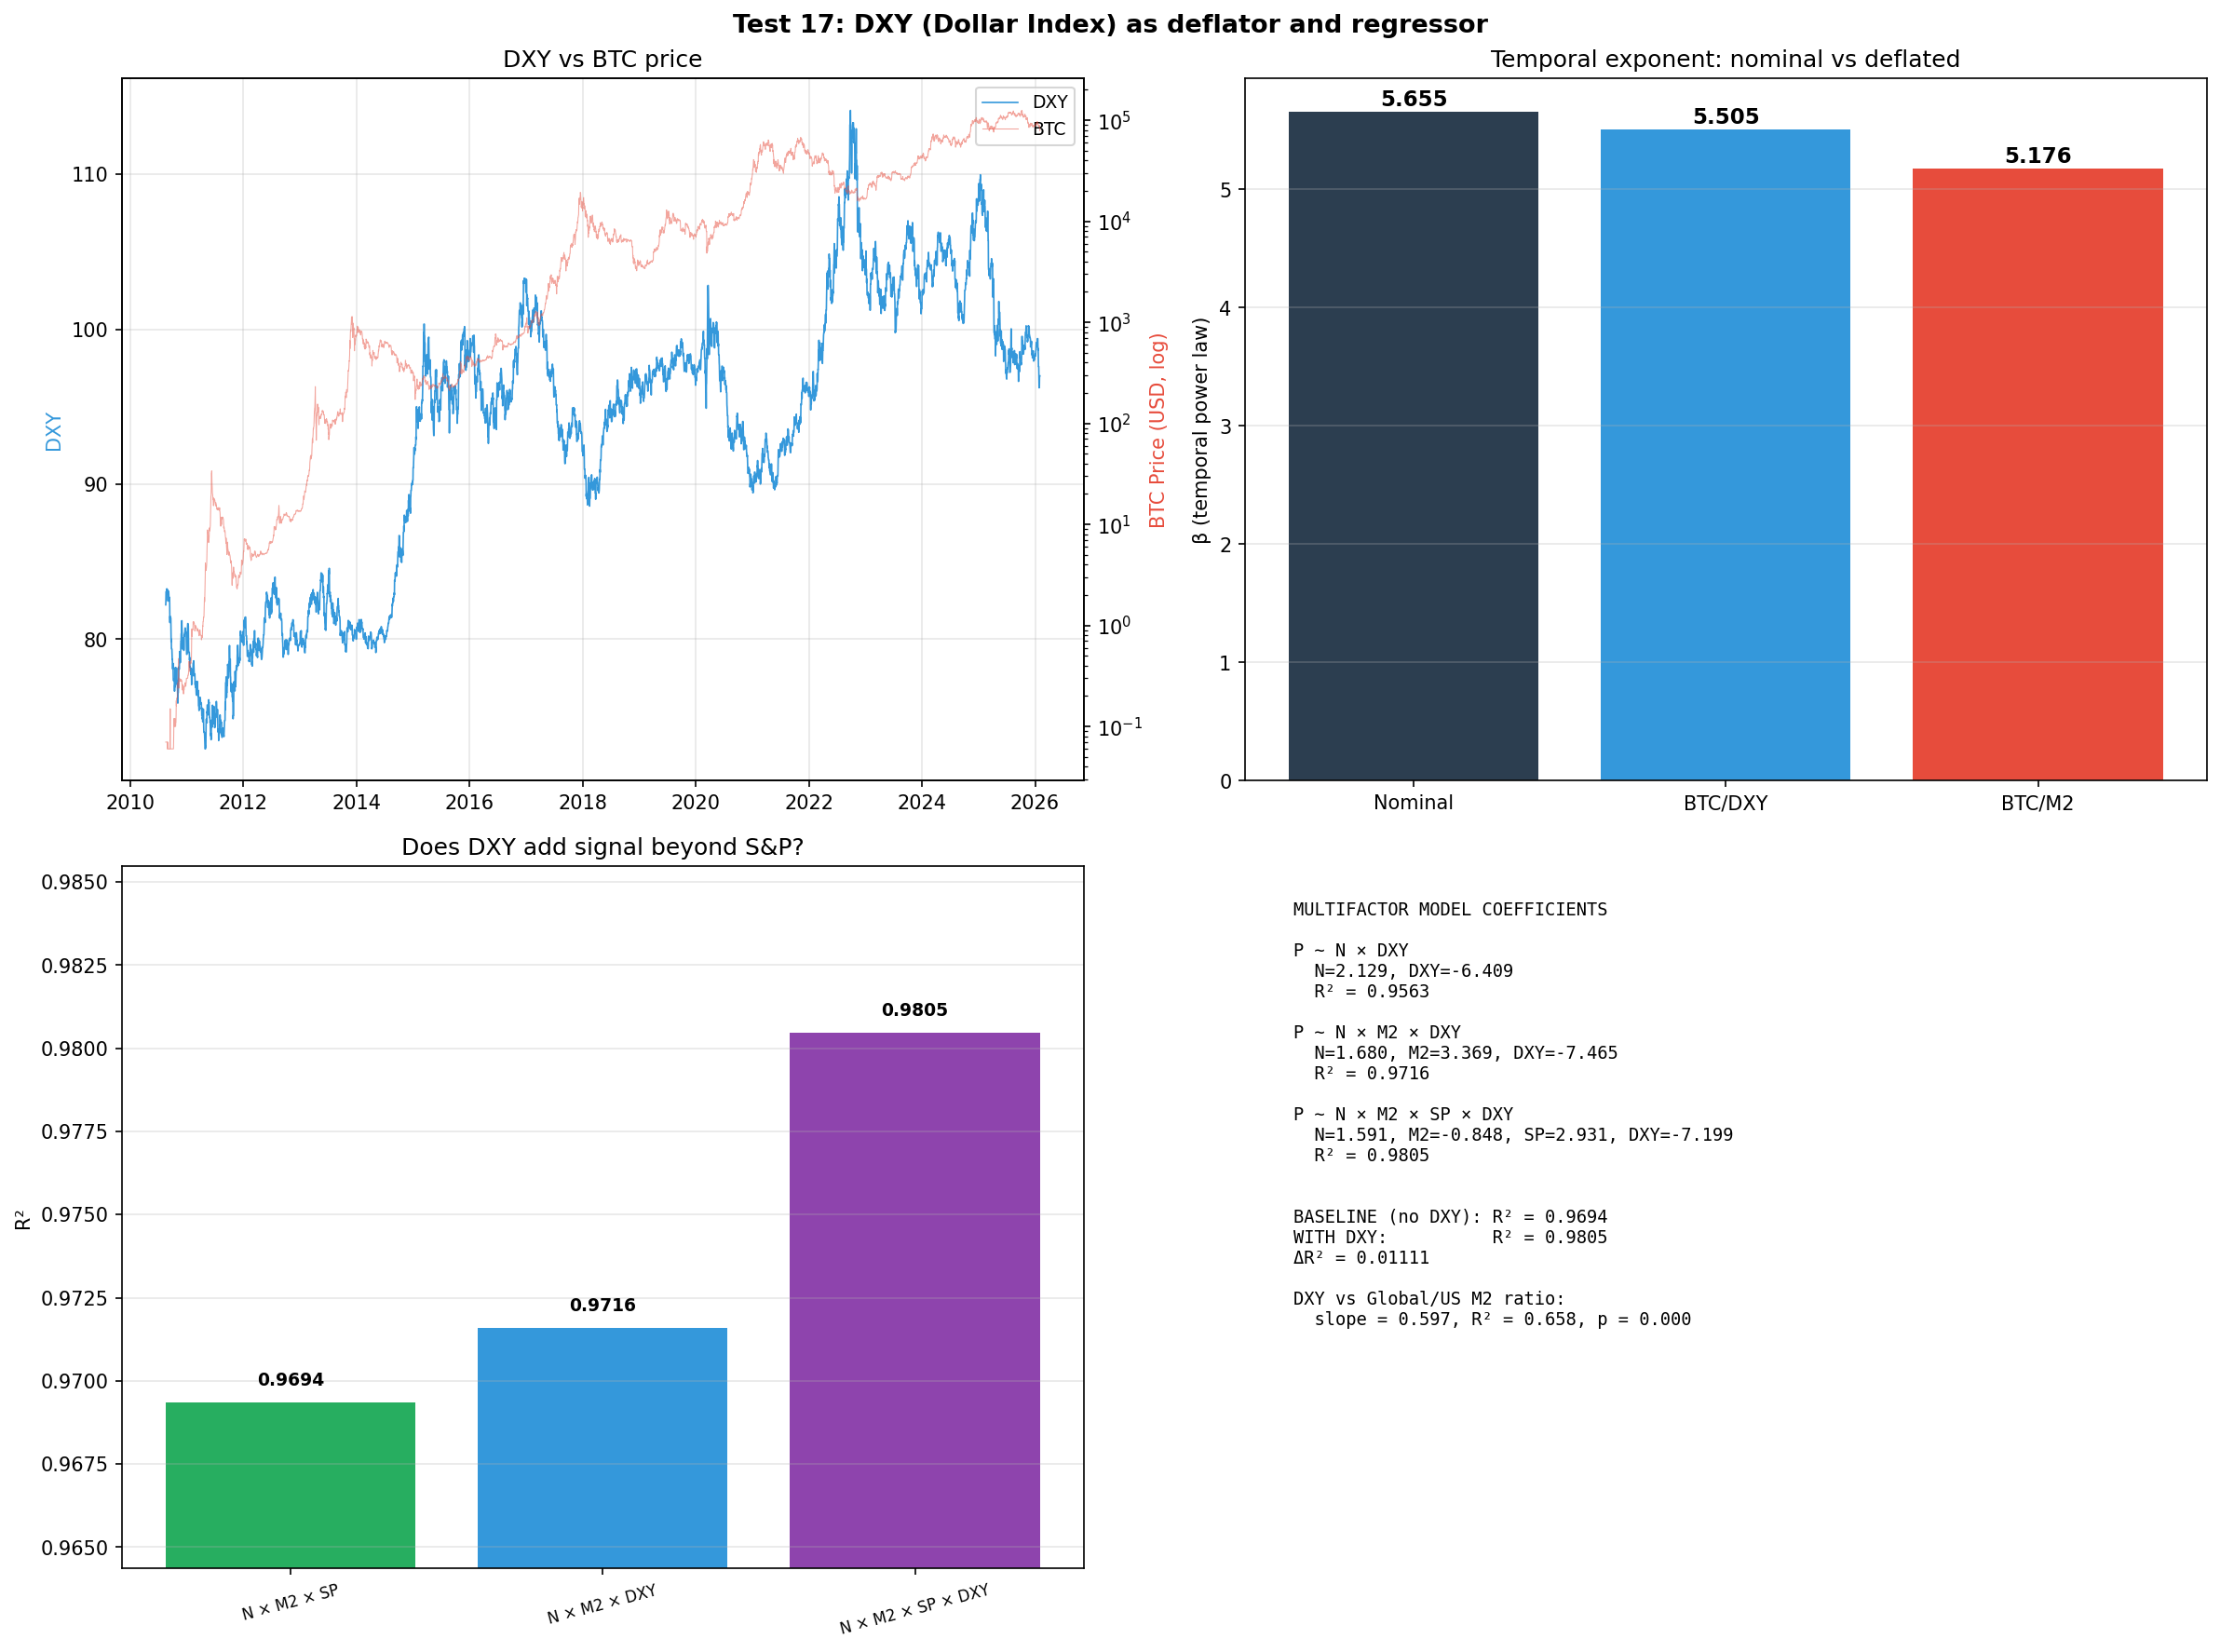
DXY figure
Test 17 detour
DXY
Dollar strength compresses BTC/USD (exponent -6.4).
Alt-CPI Cantillon figure
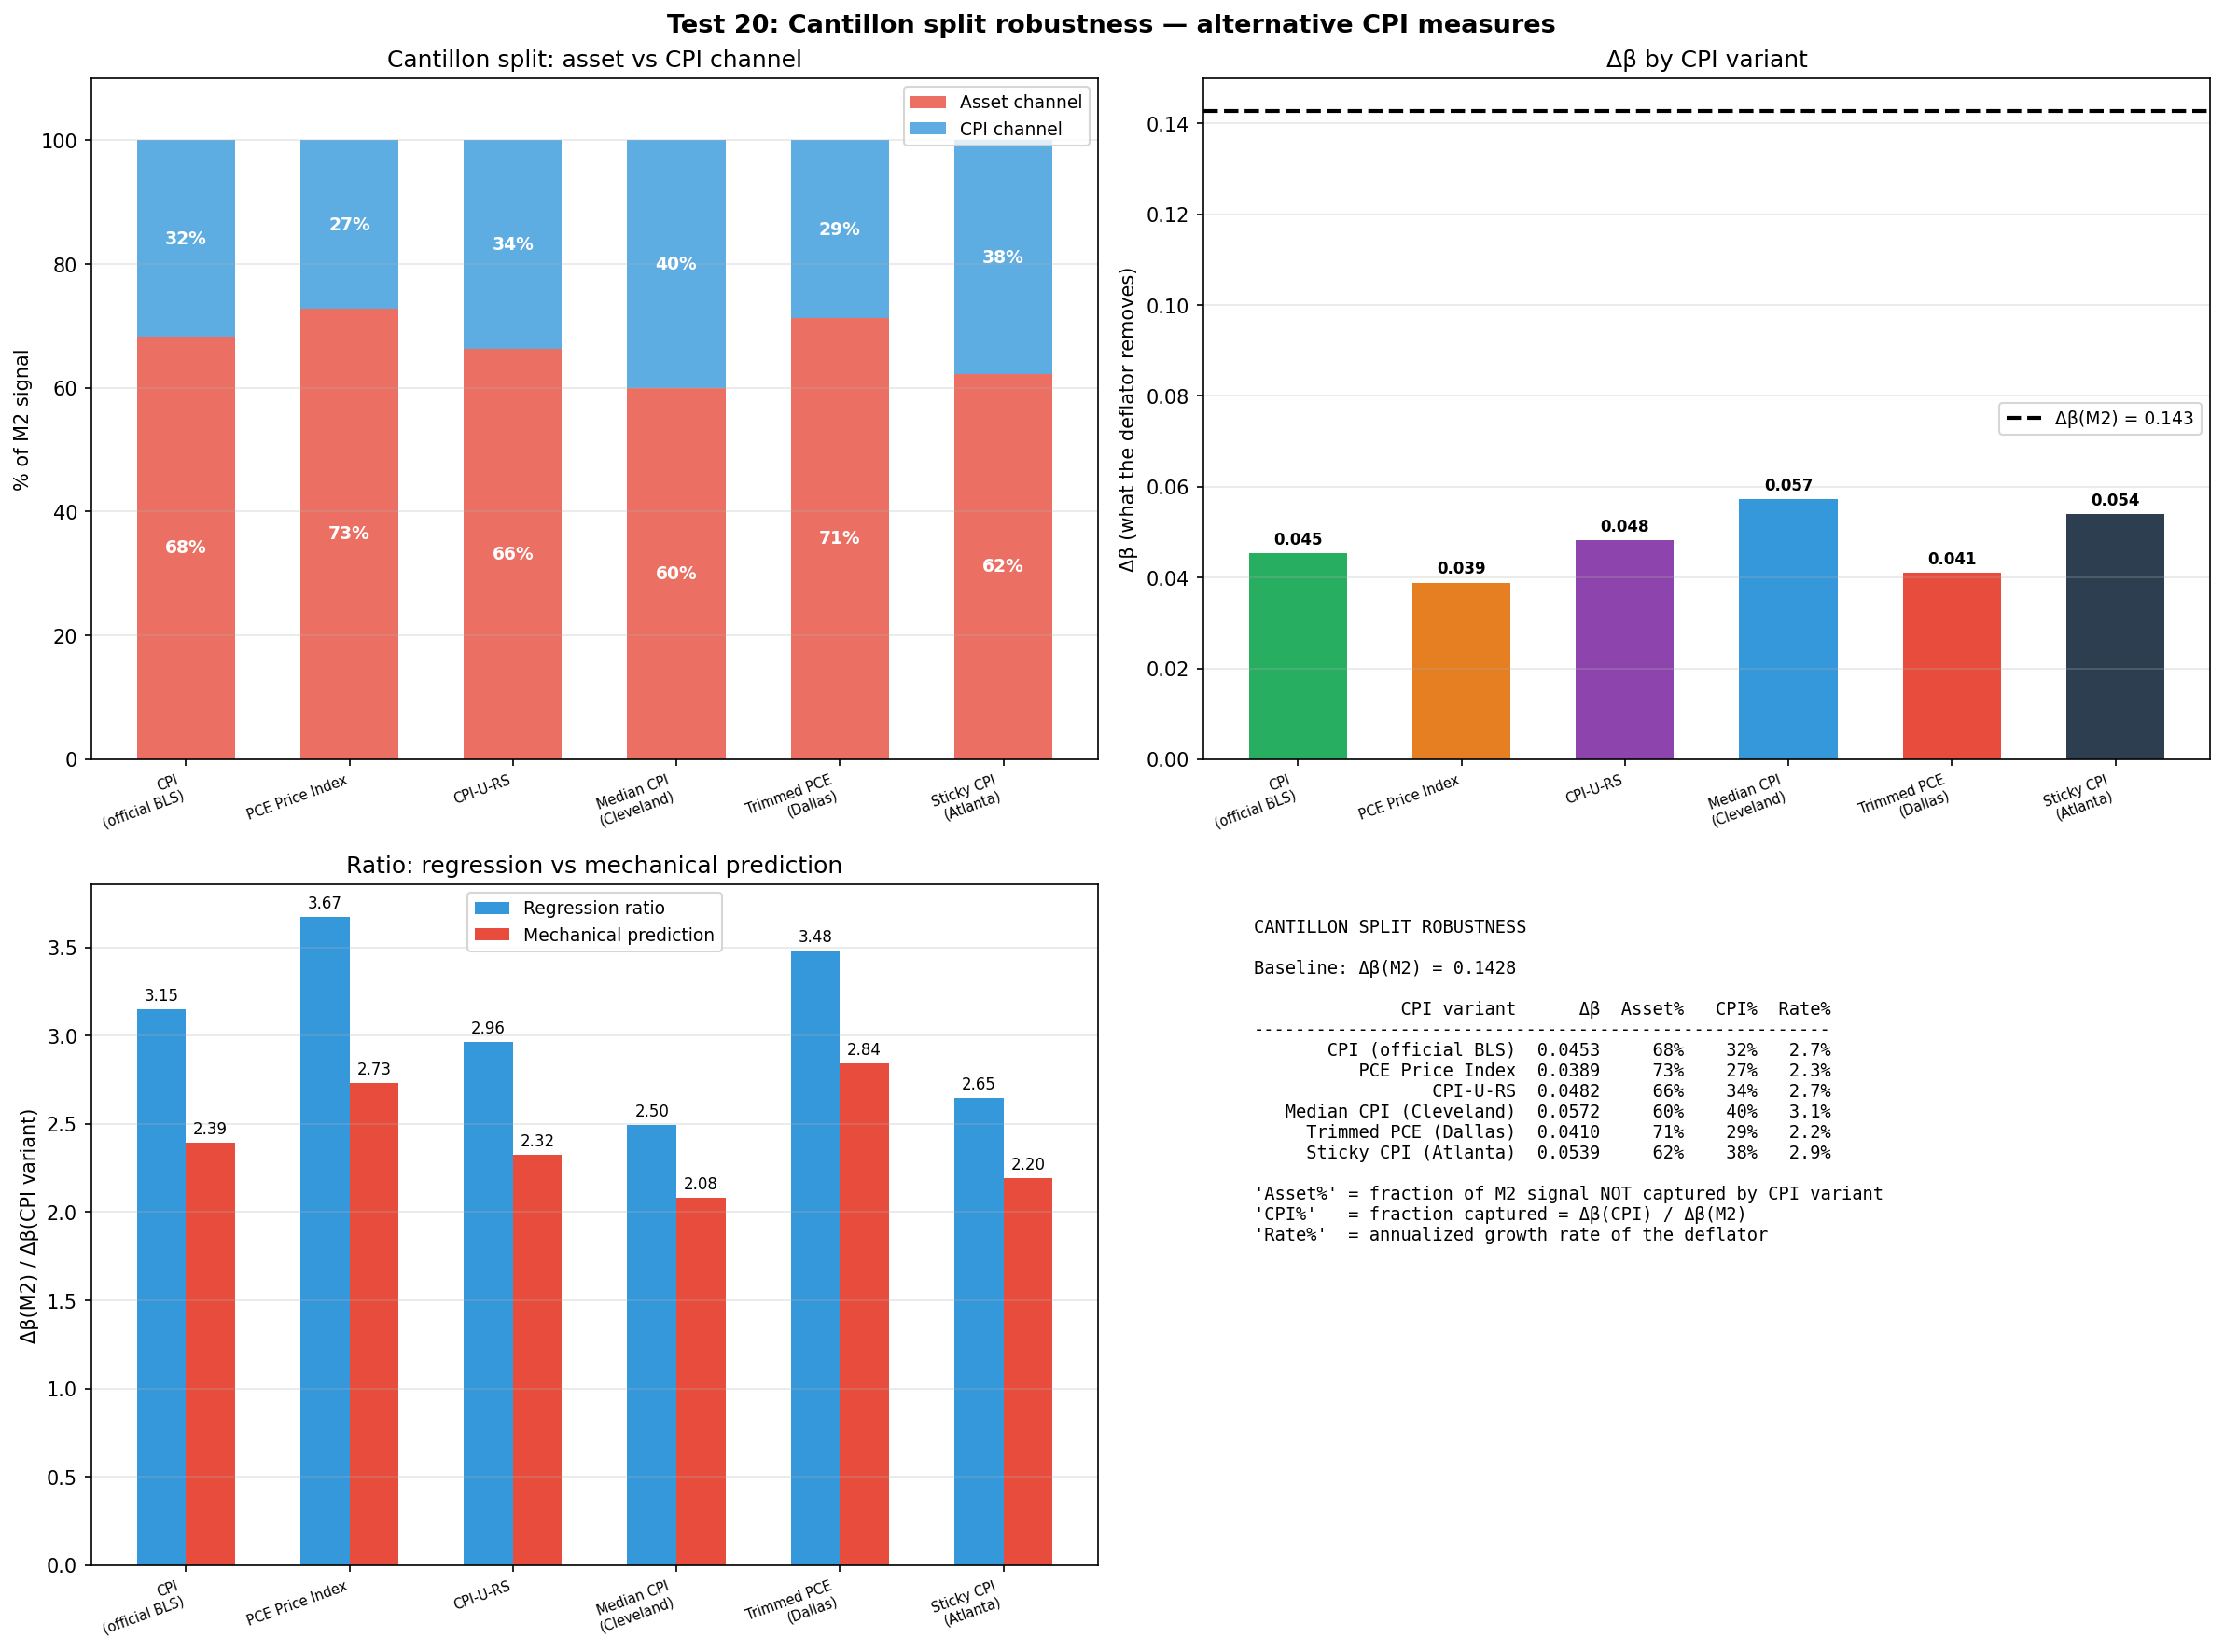
Test 20 detour
Alt-CPI Cantillon
The ~2/3 asset channel survives 6 CPI methodologies (67% +/- 5%).
Global M2 pipeline figure
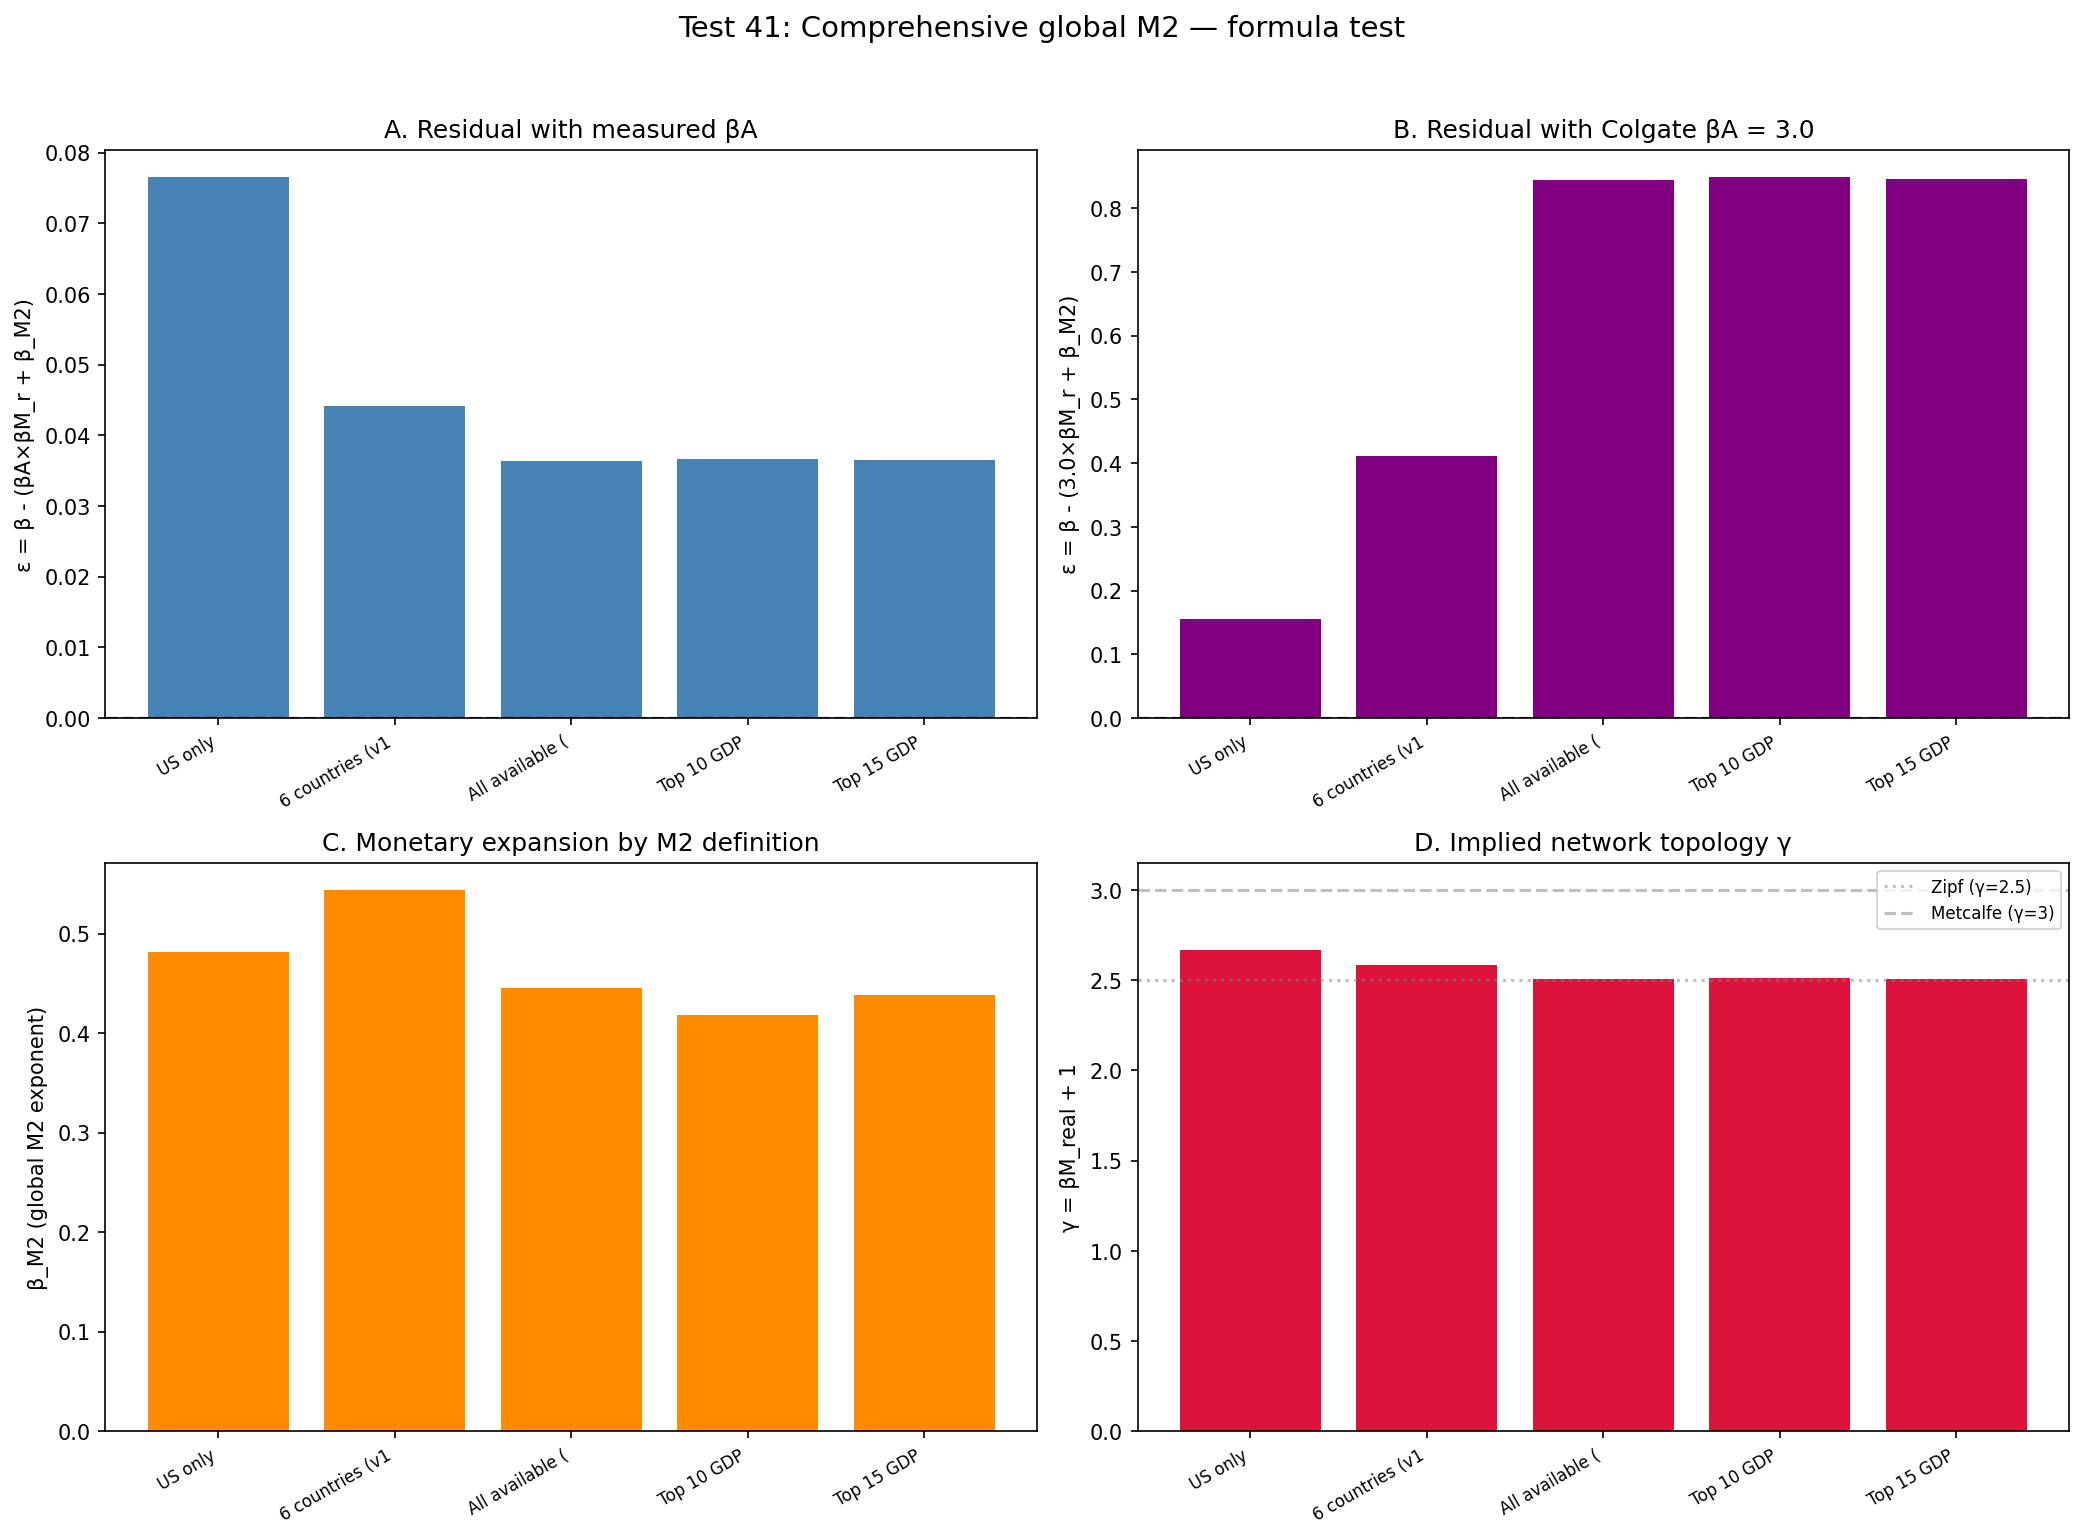
Test 40-43 detour
Global M2 pipeline
17-35 countries: epsilon(Colgate) improves to 2.7%.
Deep residual figure
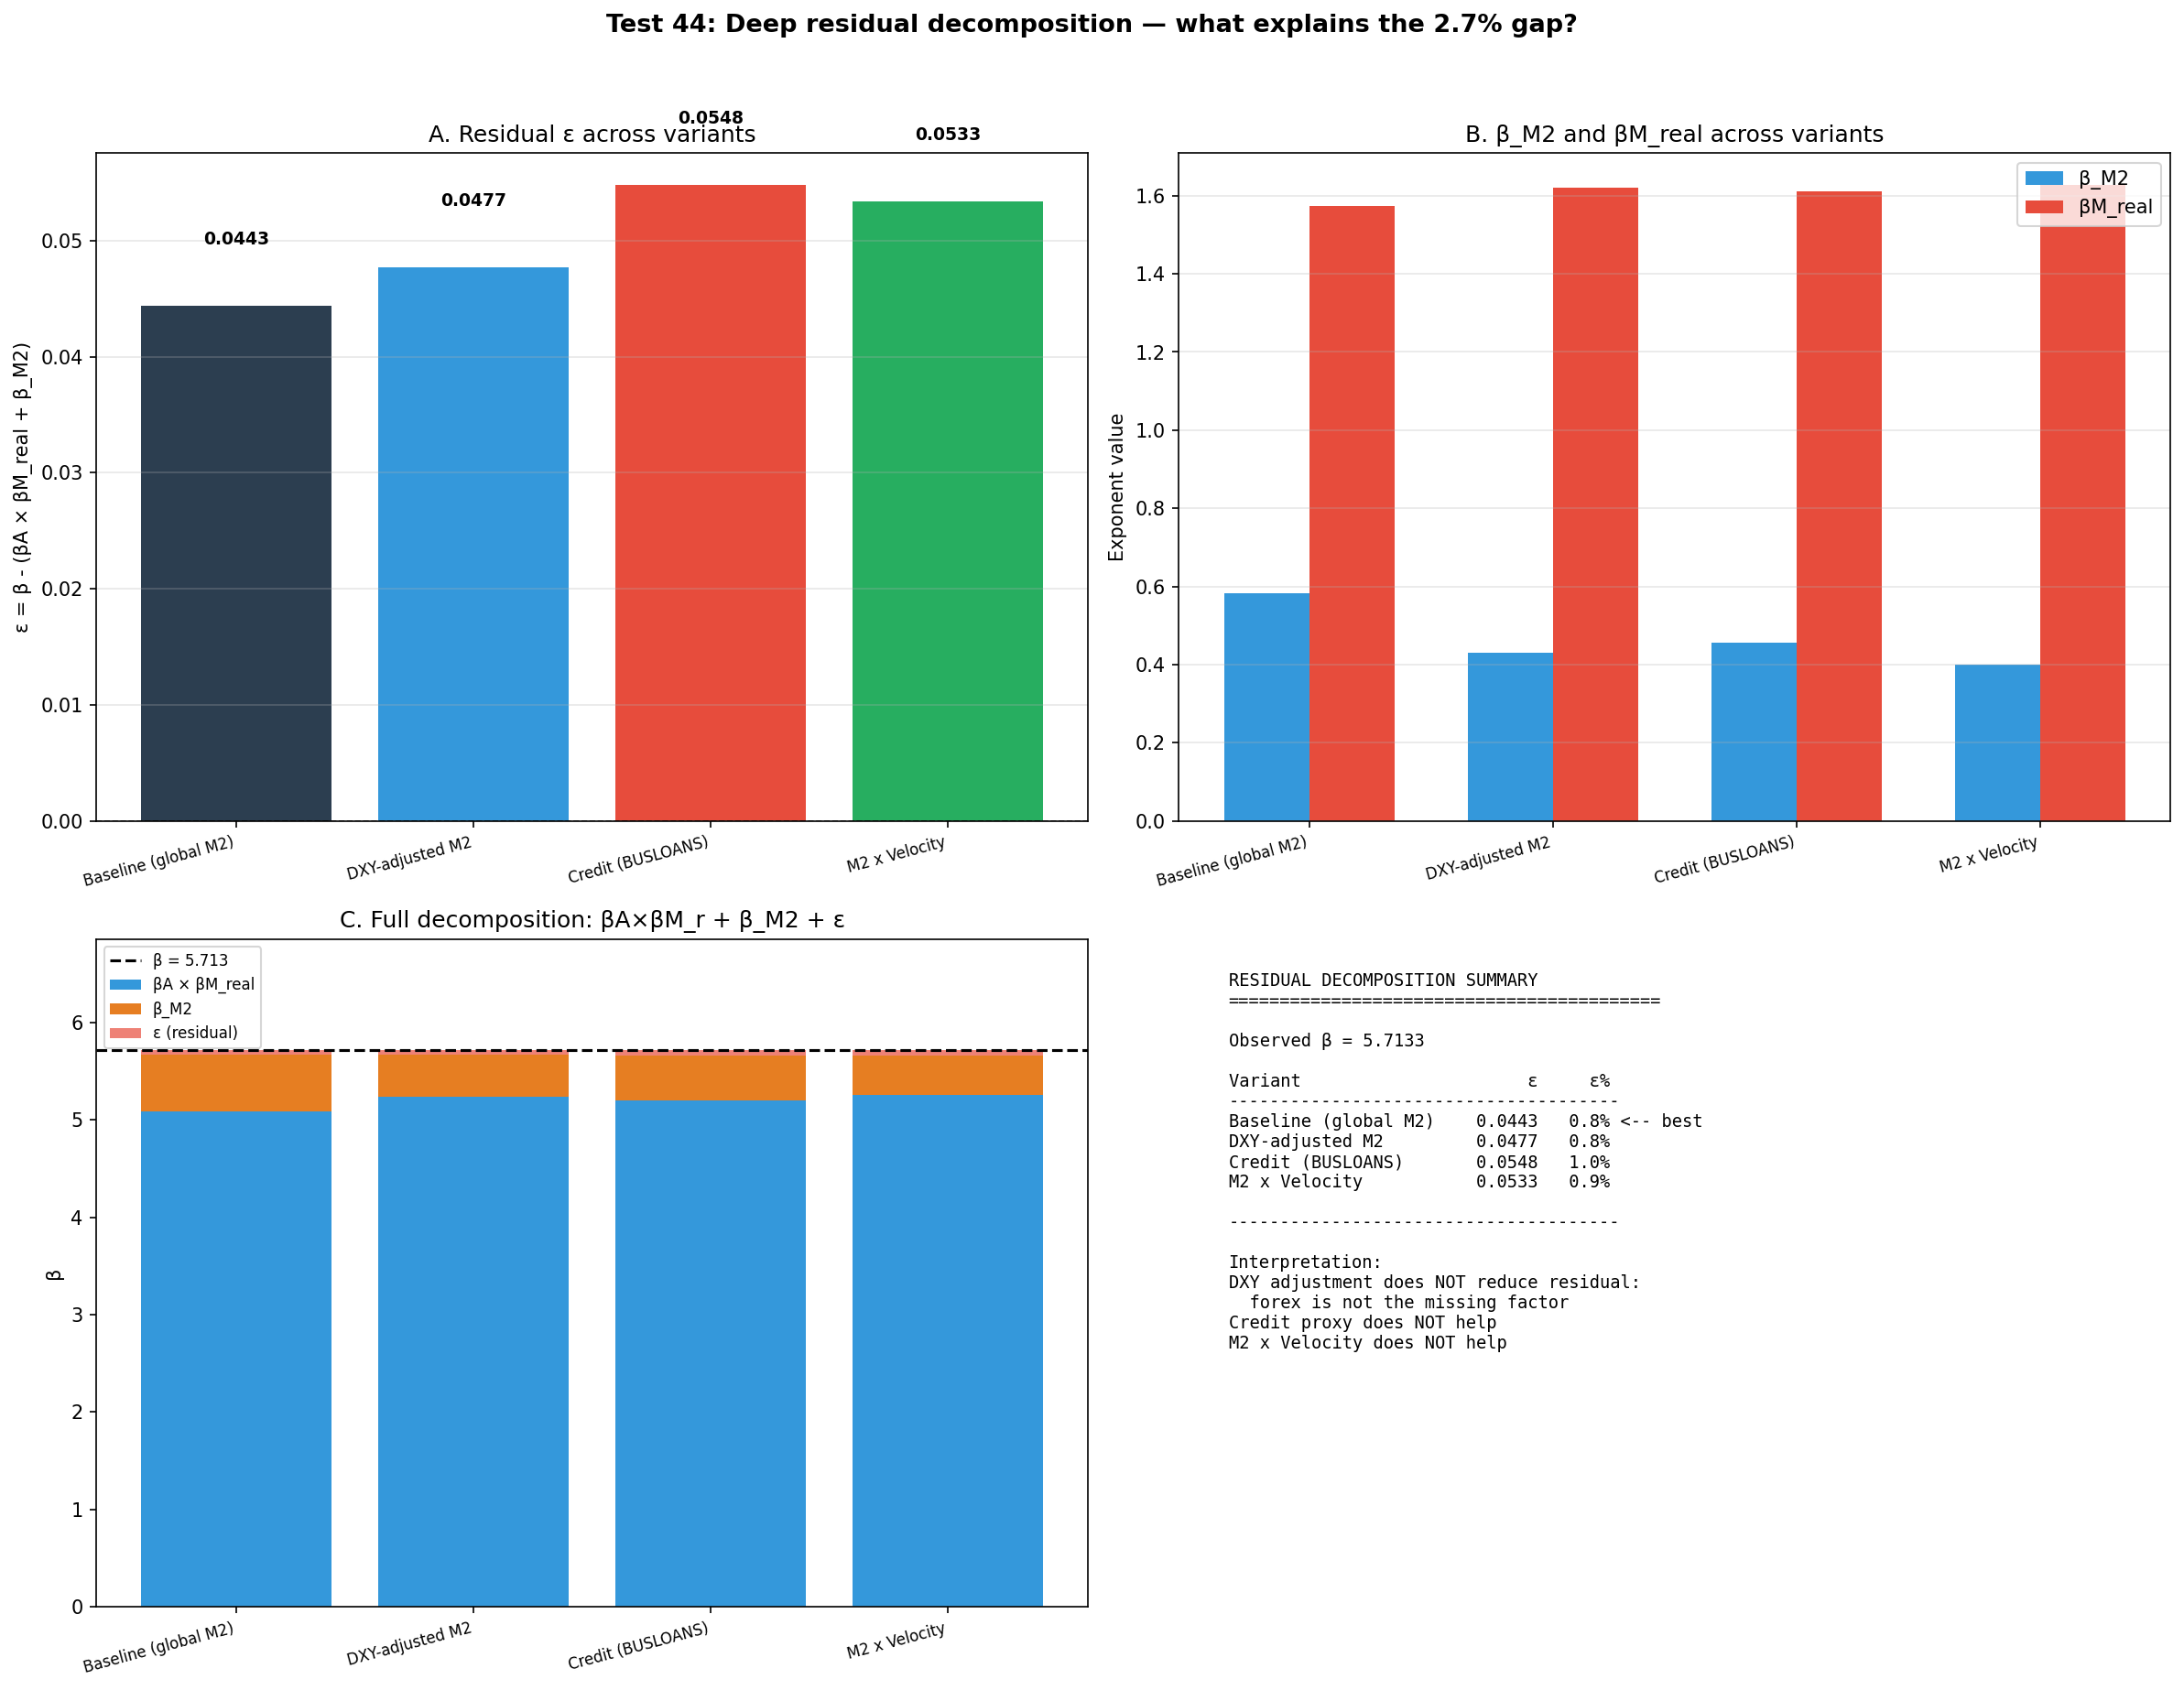
Test 44 detour
Deep residual
No variant (DXY, credit, velocity) beats raw global M2.
documentary — no figure
Test 46 detour
Two-channel M2
Non-US M2 acts through adoption, not the denominator.
documentary — no figure
Test 47 detour
Deflator comparison
M2 x Loans is the optimal deflator (epsilon = 0.07%).
documentary — no figure
Test 48 detour
Global Cantillon
Globally the split is 49/51, not 68/32 - the US result was local.
Credit US/non-US figure
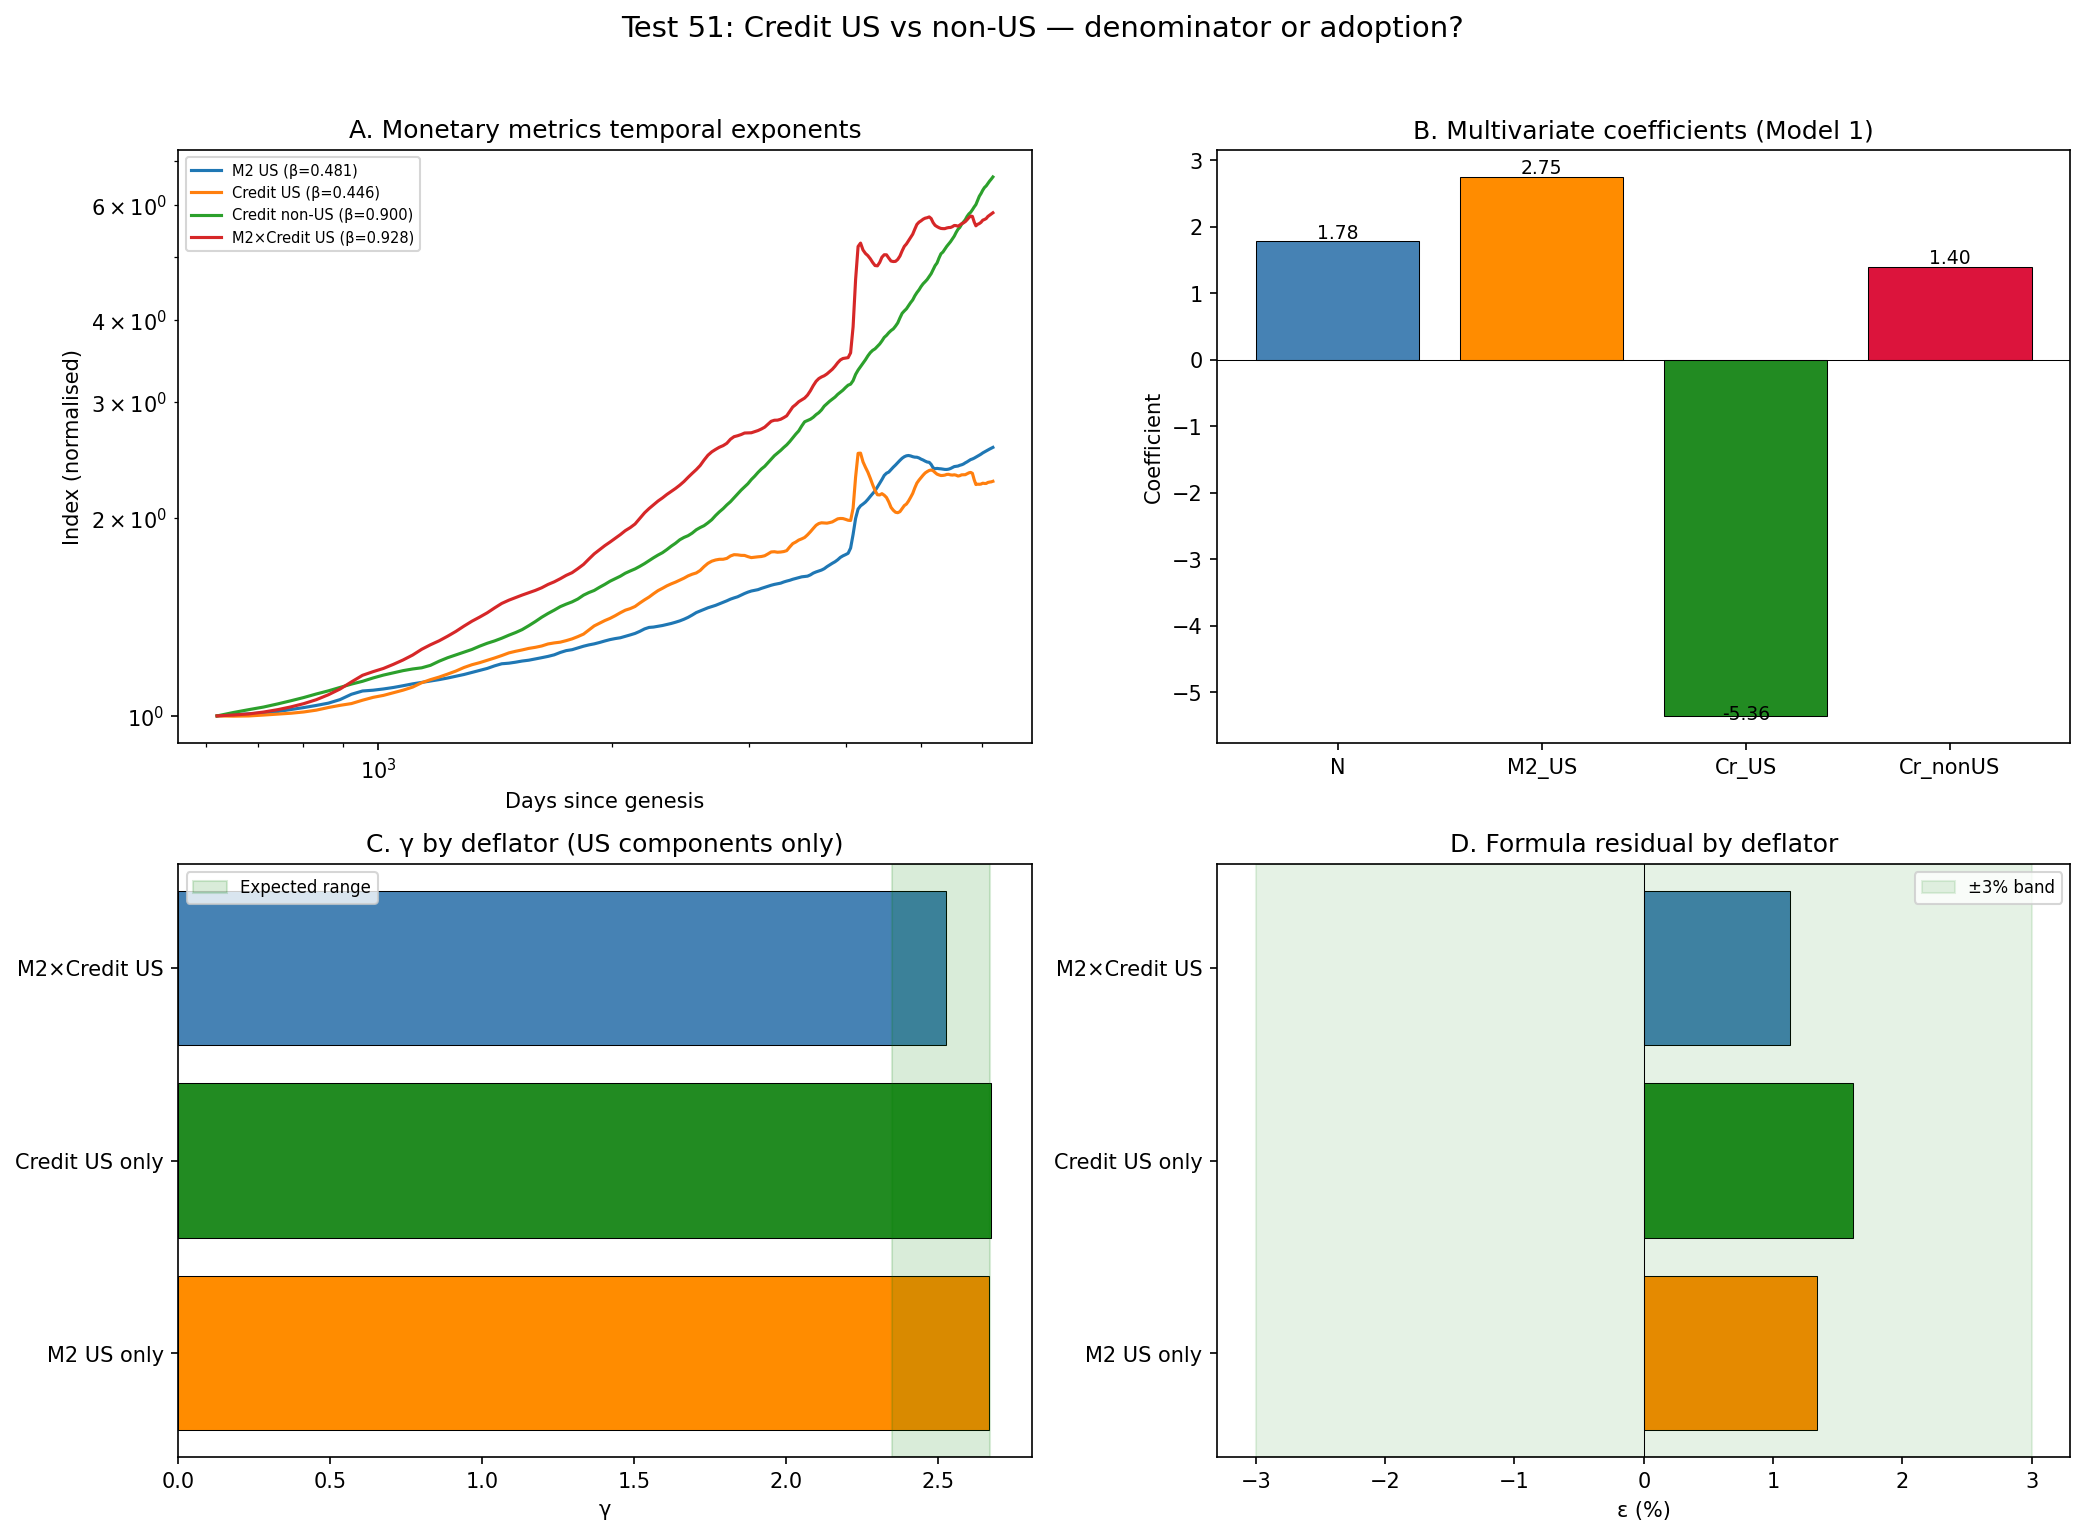
Test 51 detour
Credit US/non-US
Multicollinearity prevents separating the credit channels.
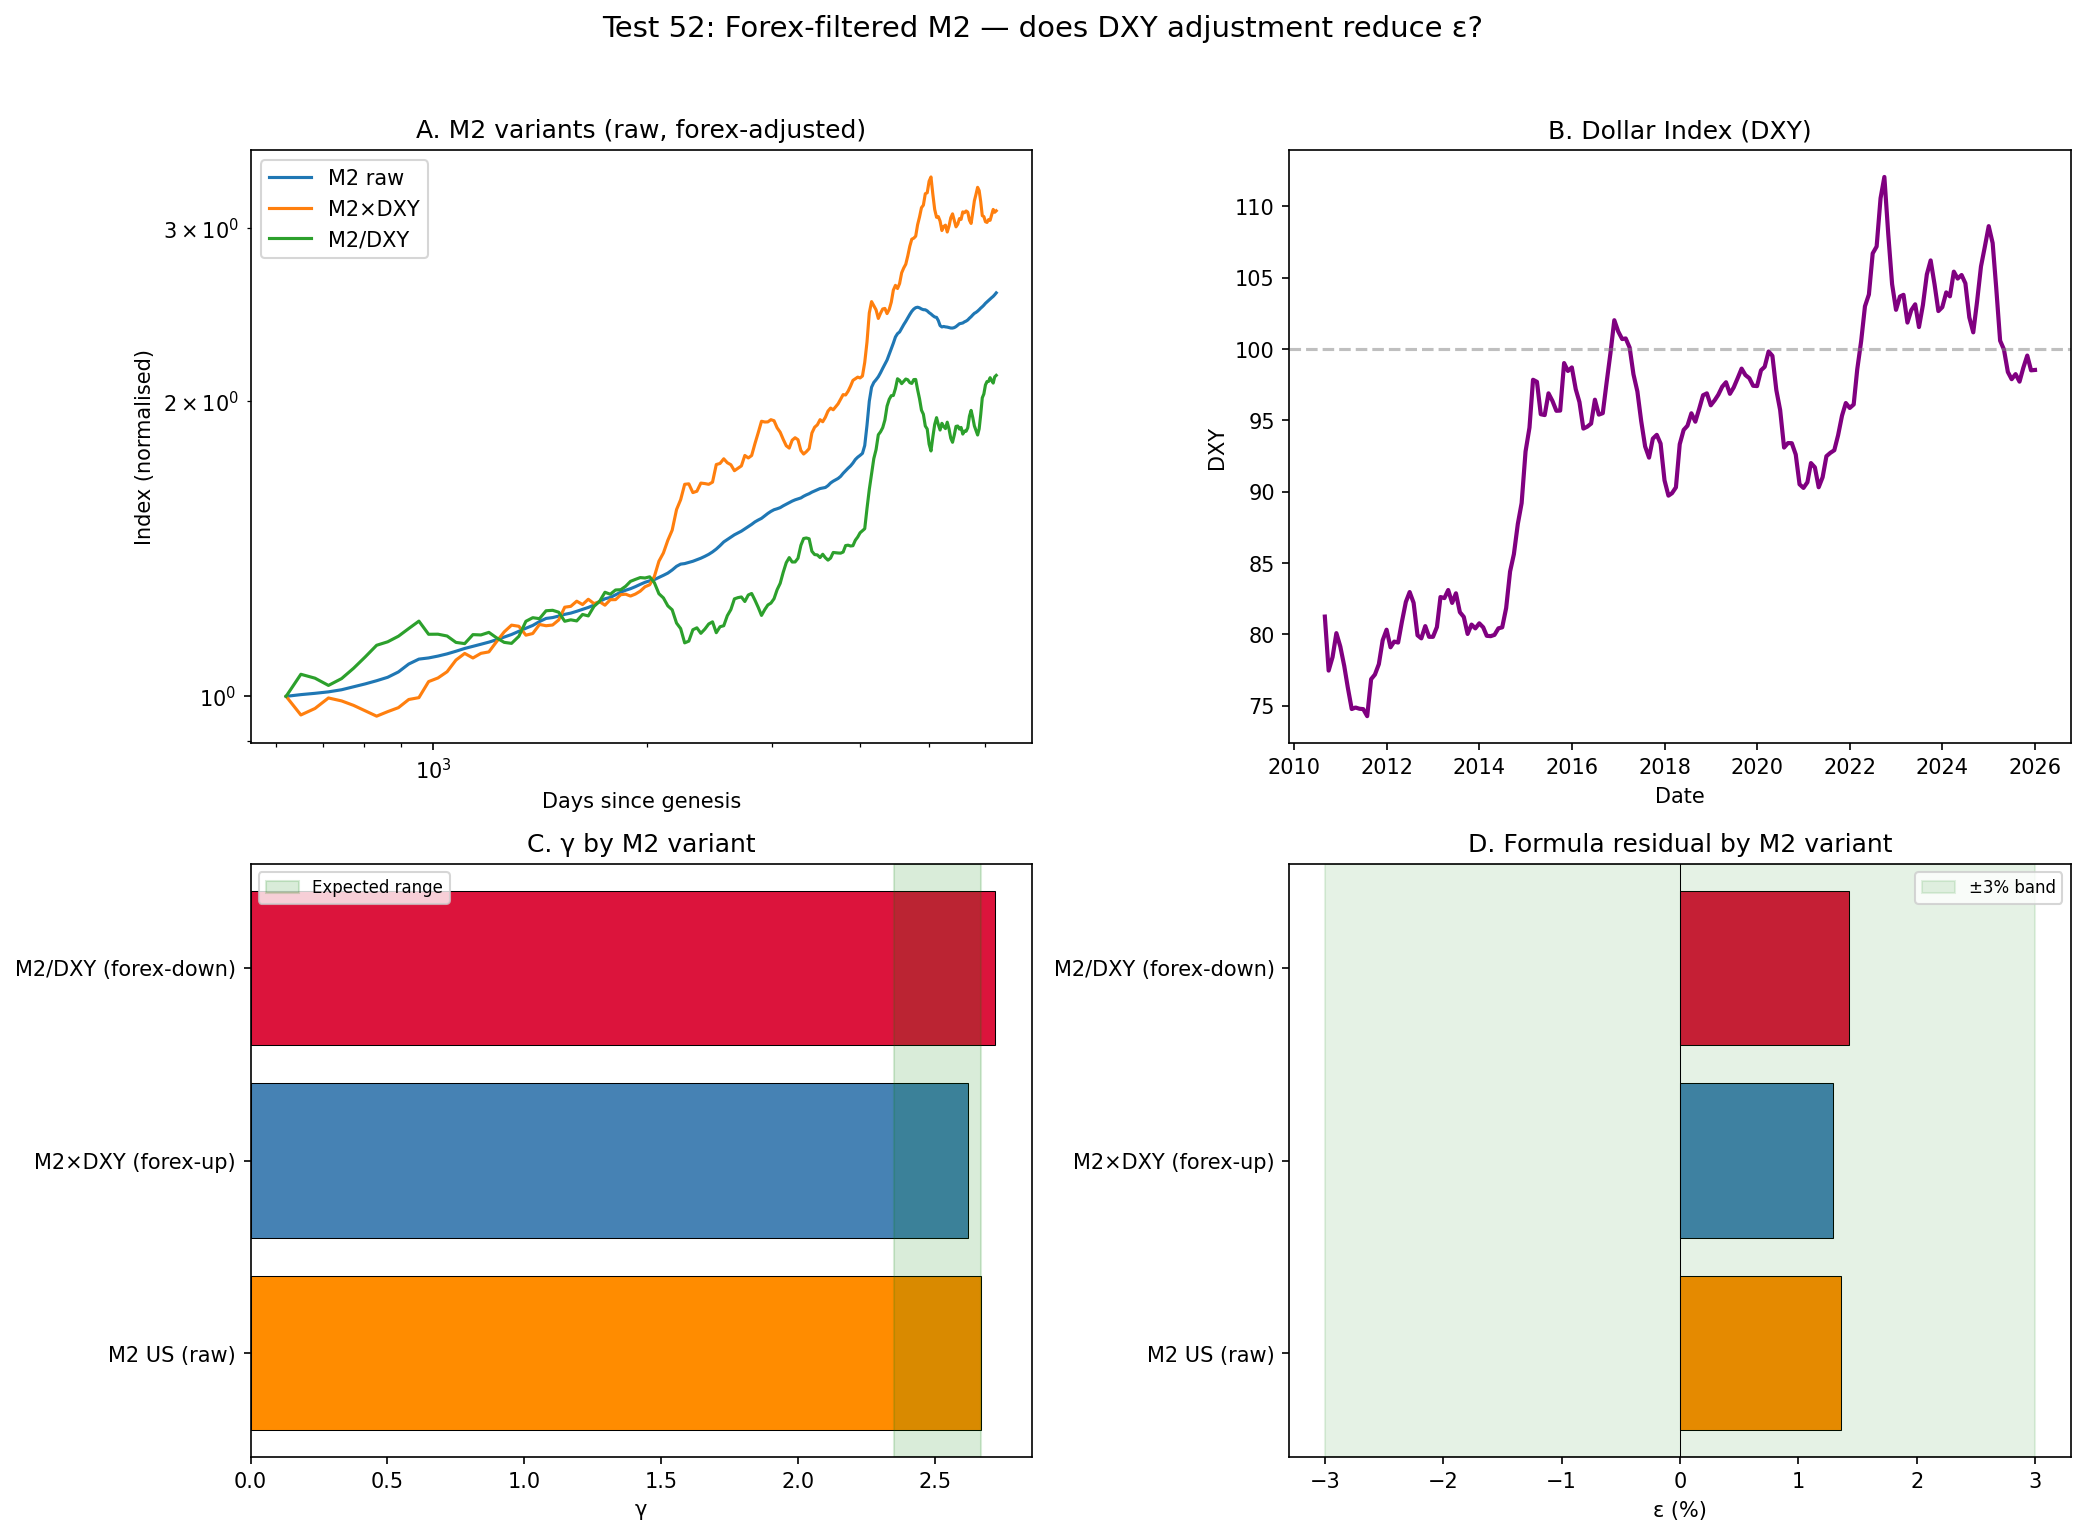
Forex residual figure
Test 52 detour
Forex residual
DXY adjustment does not reduce the residual (1.4% to 1.3%).

Measurement and proxies

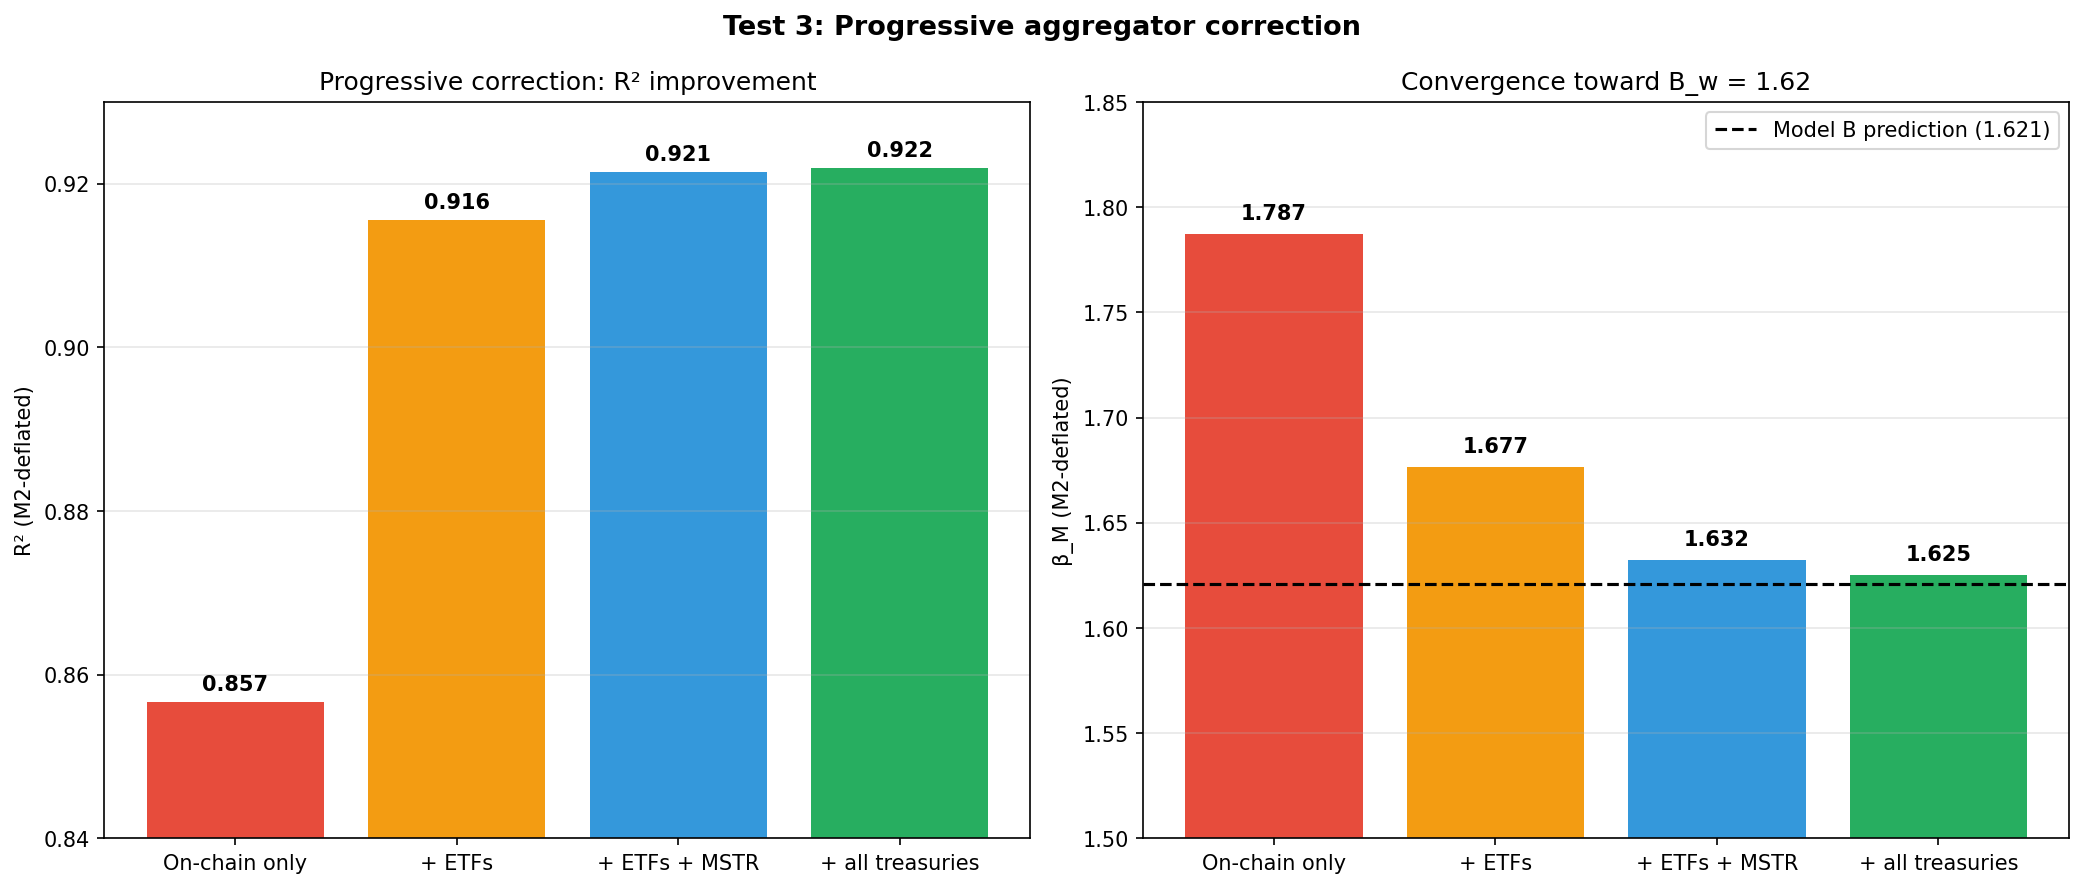
ETF correction figure
Test 3 corroborative
ETF correction
The post-2024 address stall is an ETF aggregation artefact.
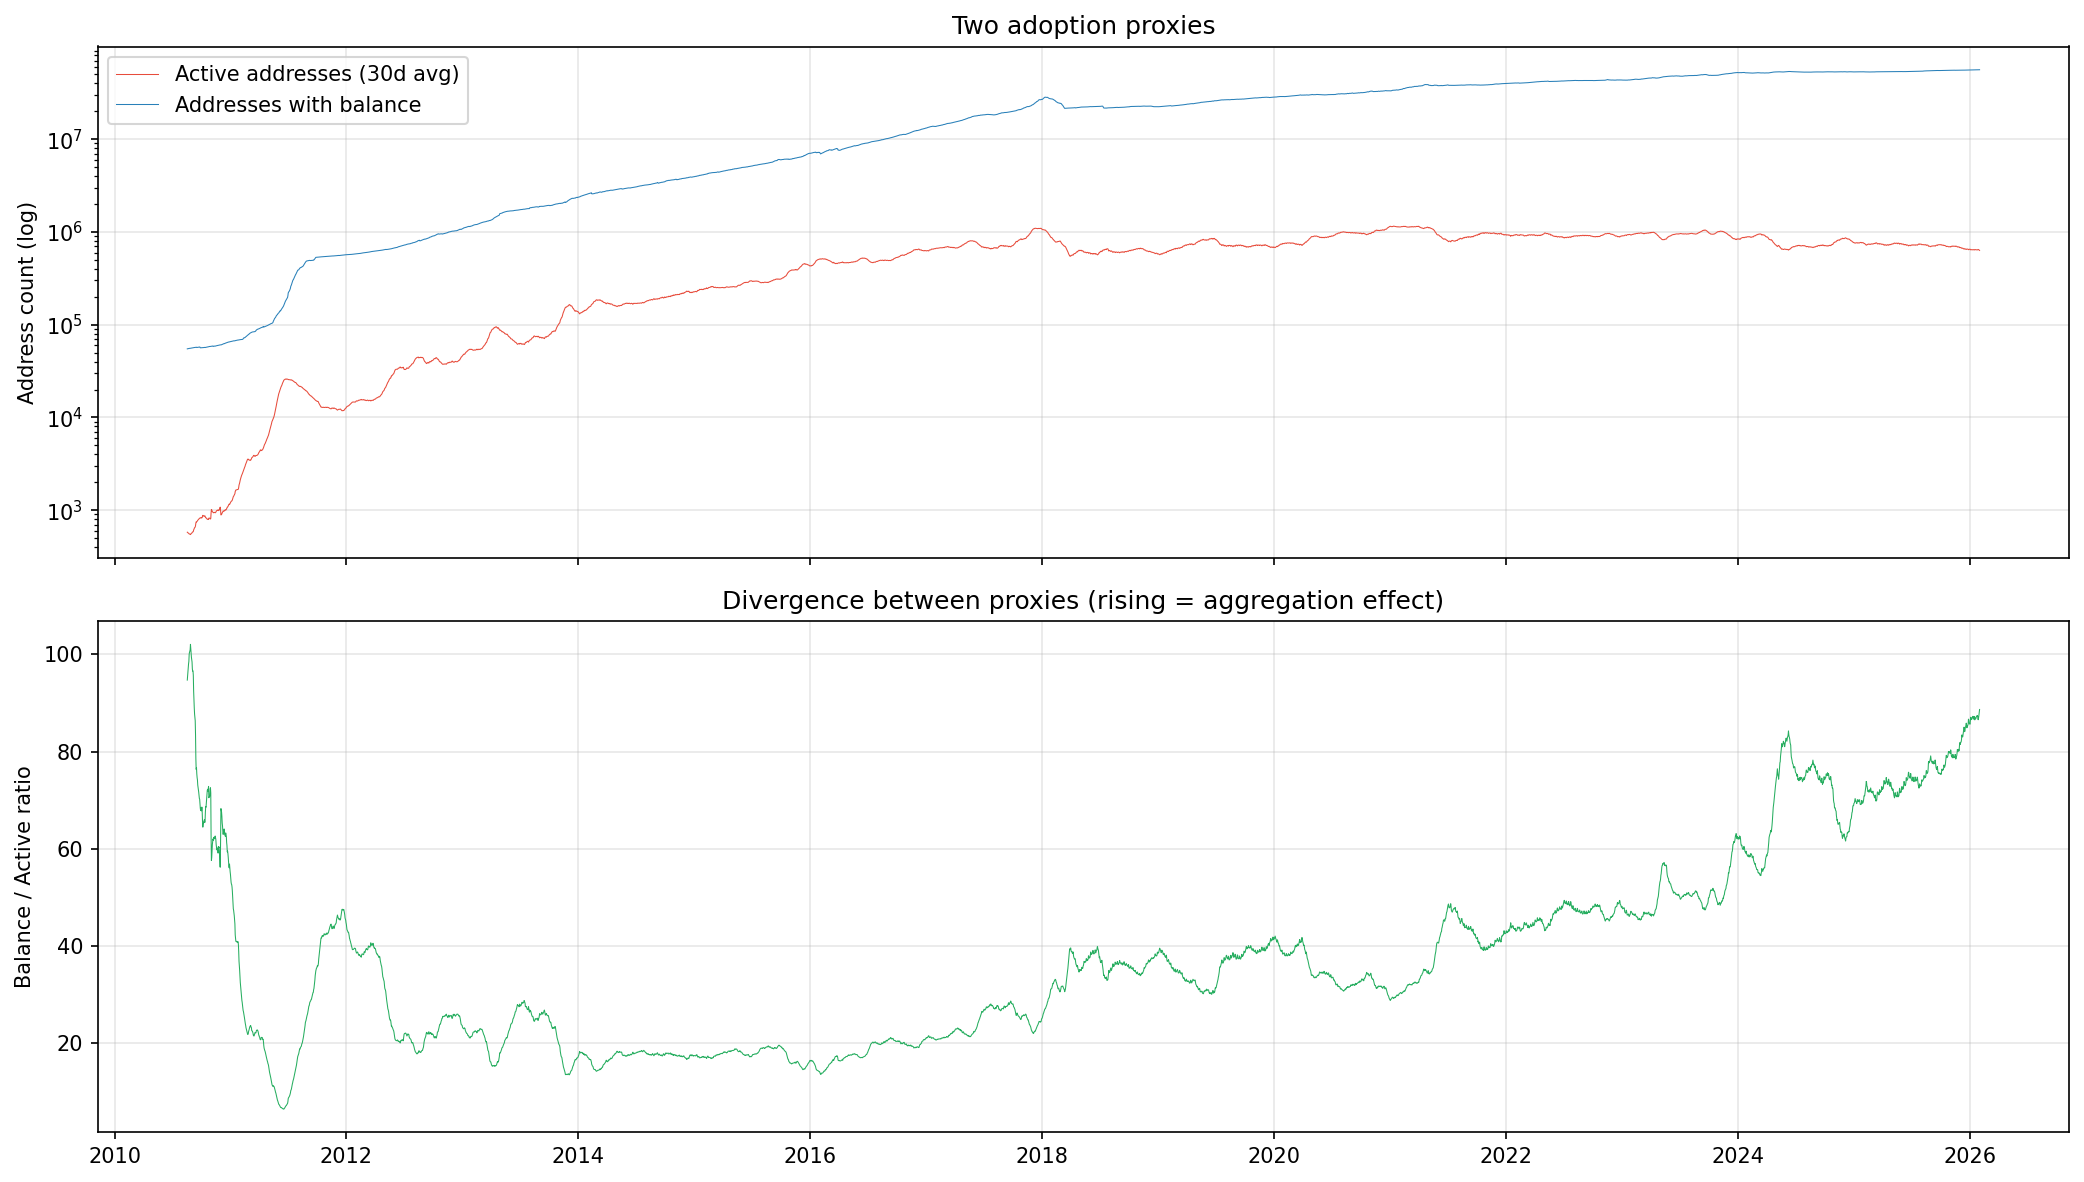
Proxy deep dive figure
Test 12 corroborative
Proxy deep dive
The balance proxy fits better (R² 0.947) and kills B_x.
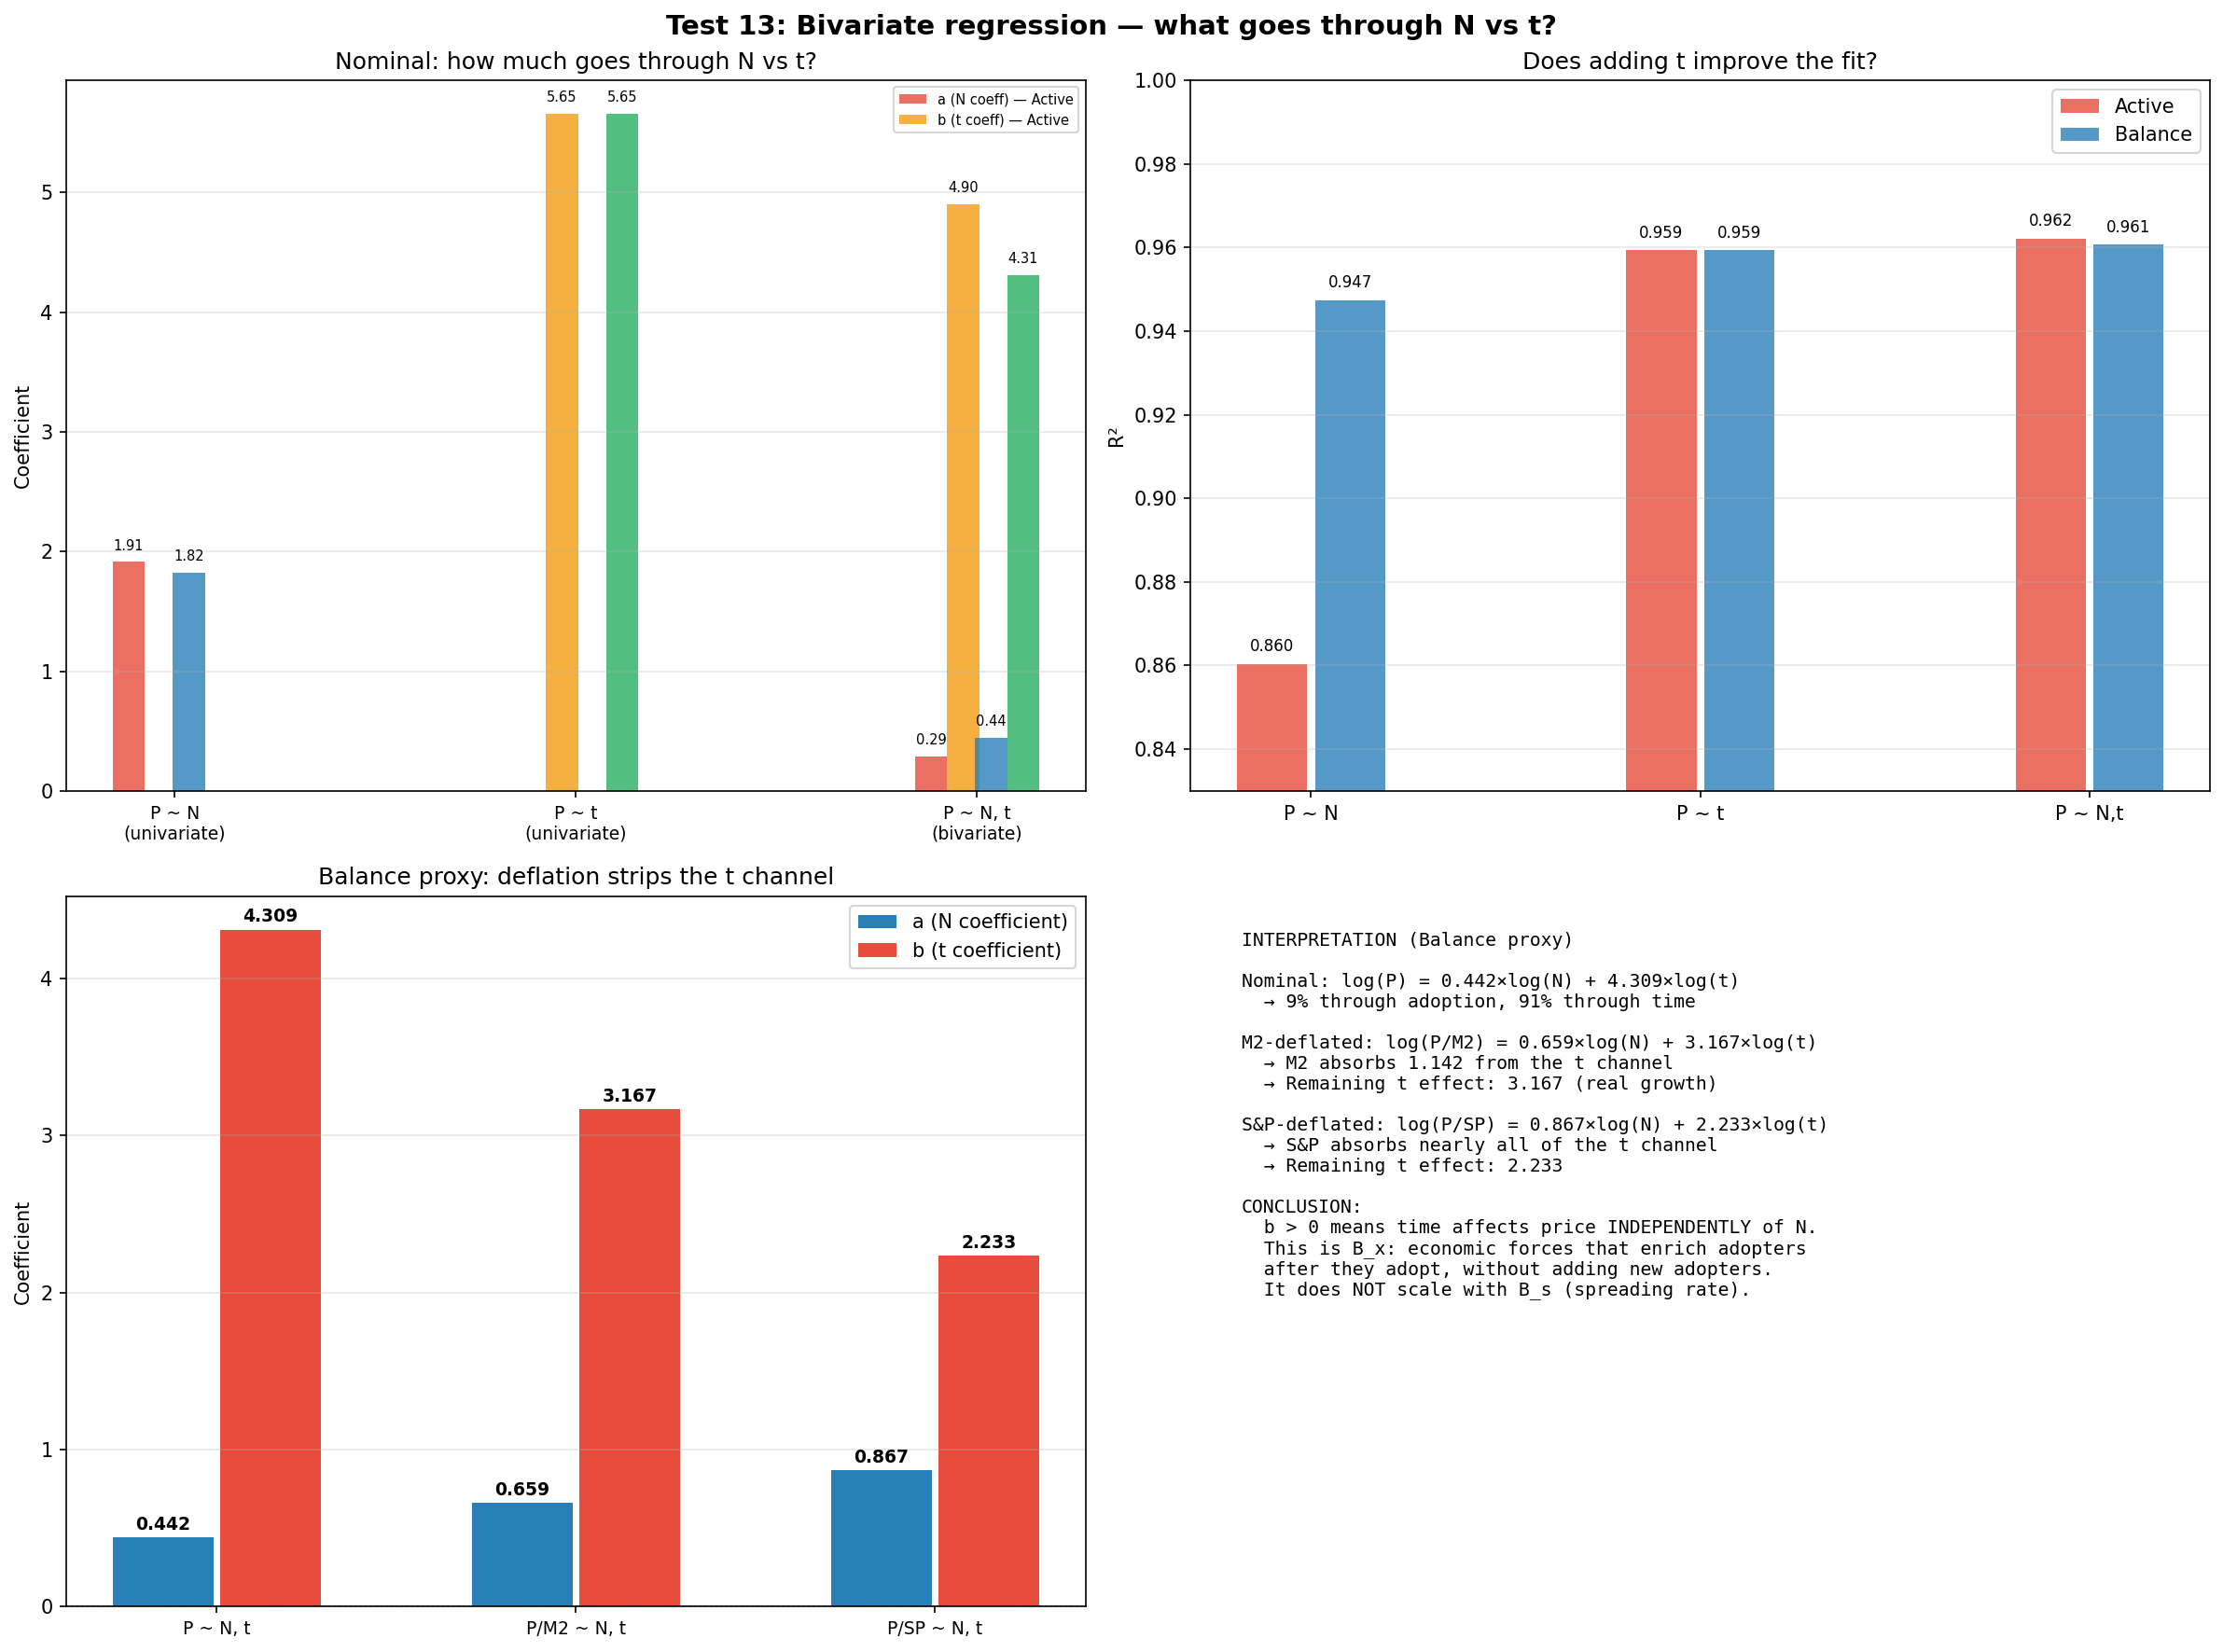
Bivariate N vs t figure
Test 13 corroborative
Bivariate N vs t
N and t are too collinear (R² 0.976) for causal attribution.
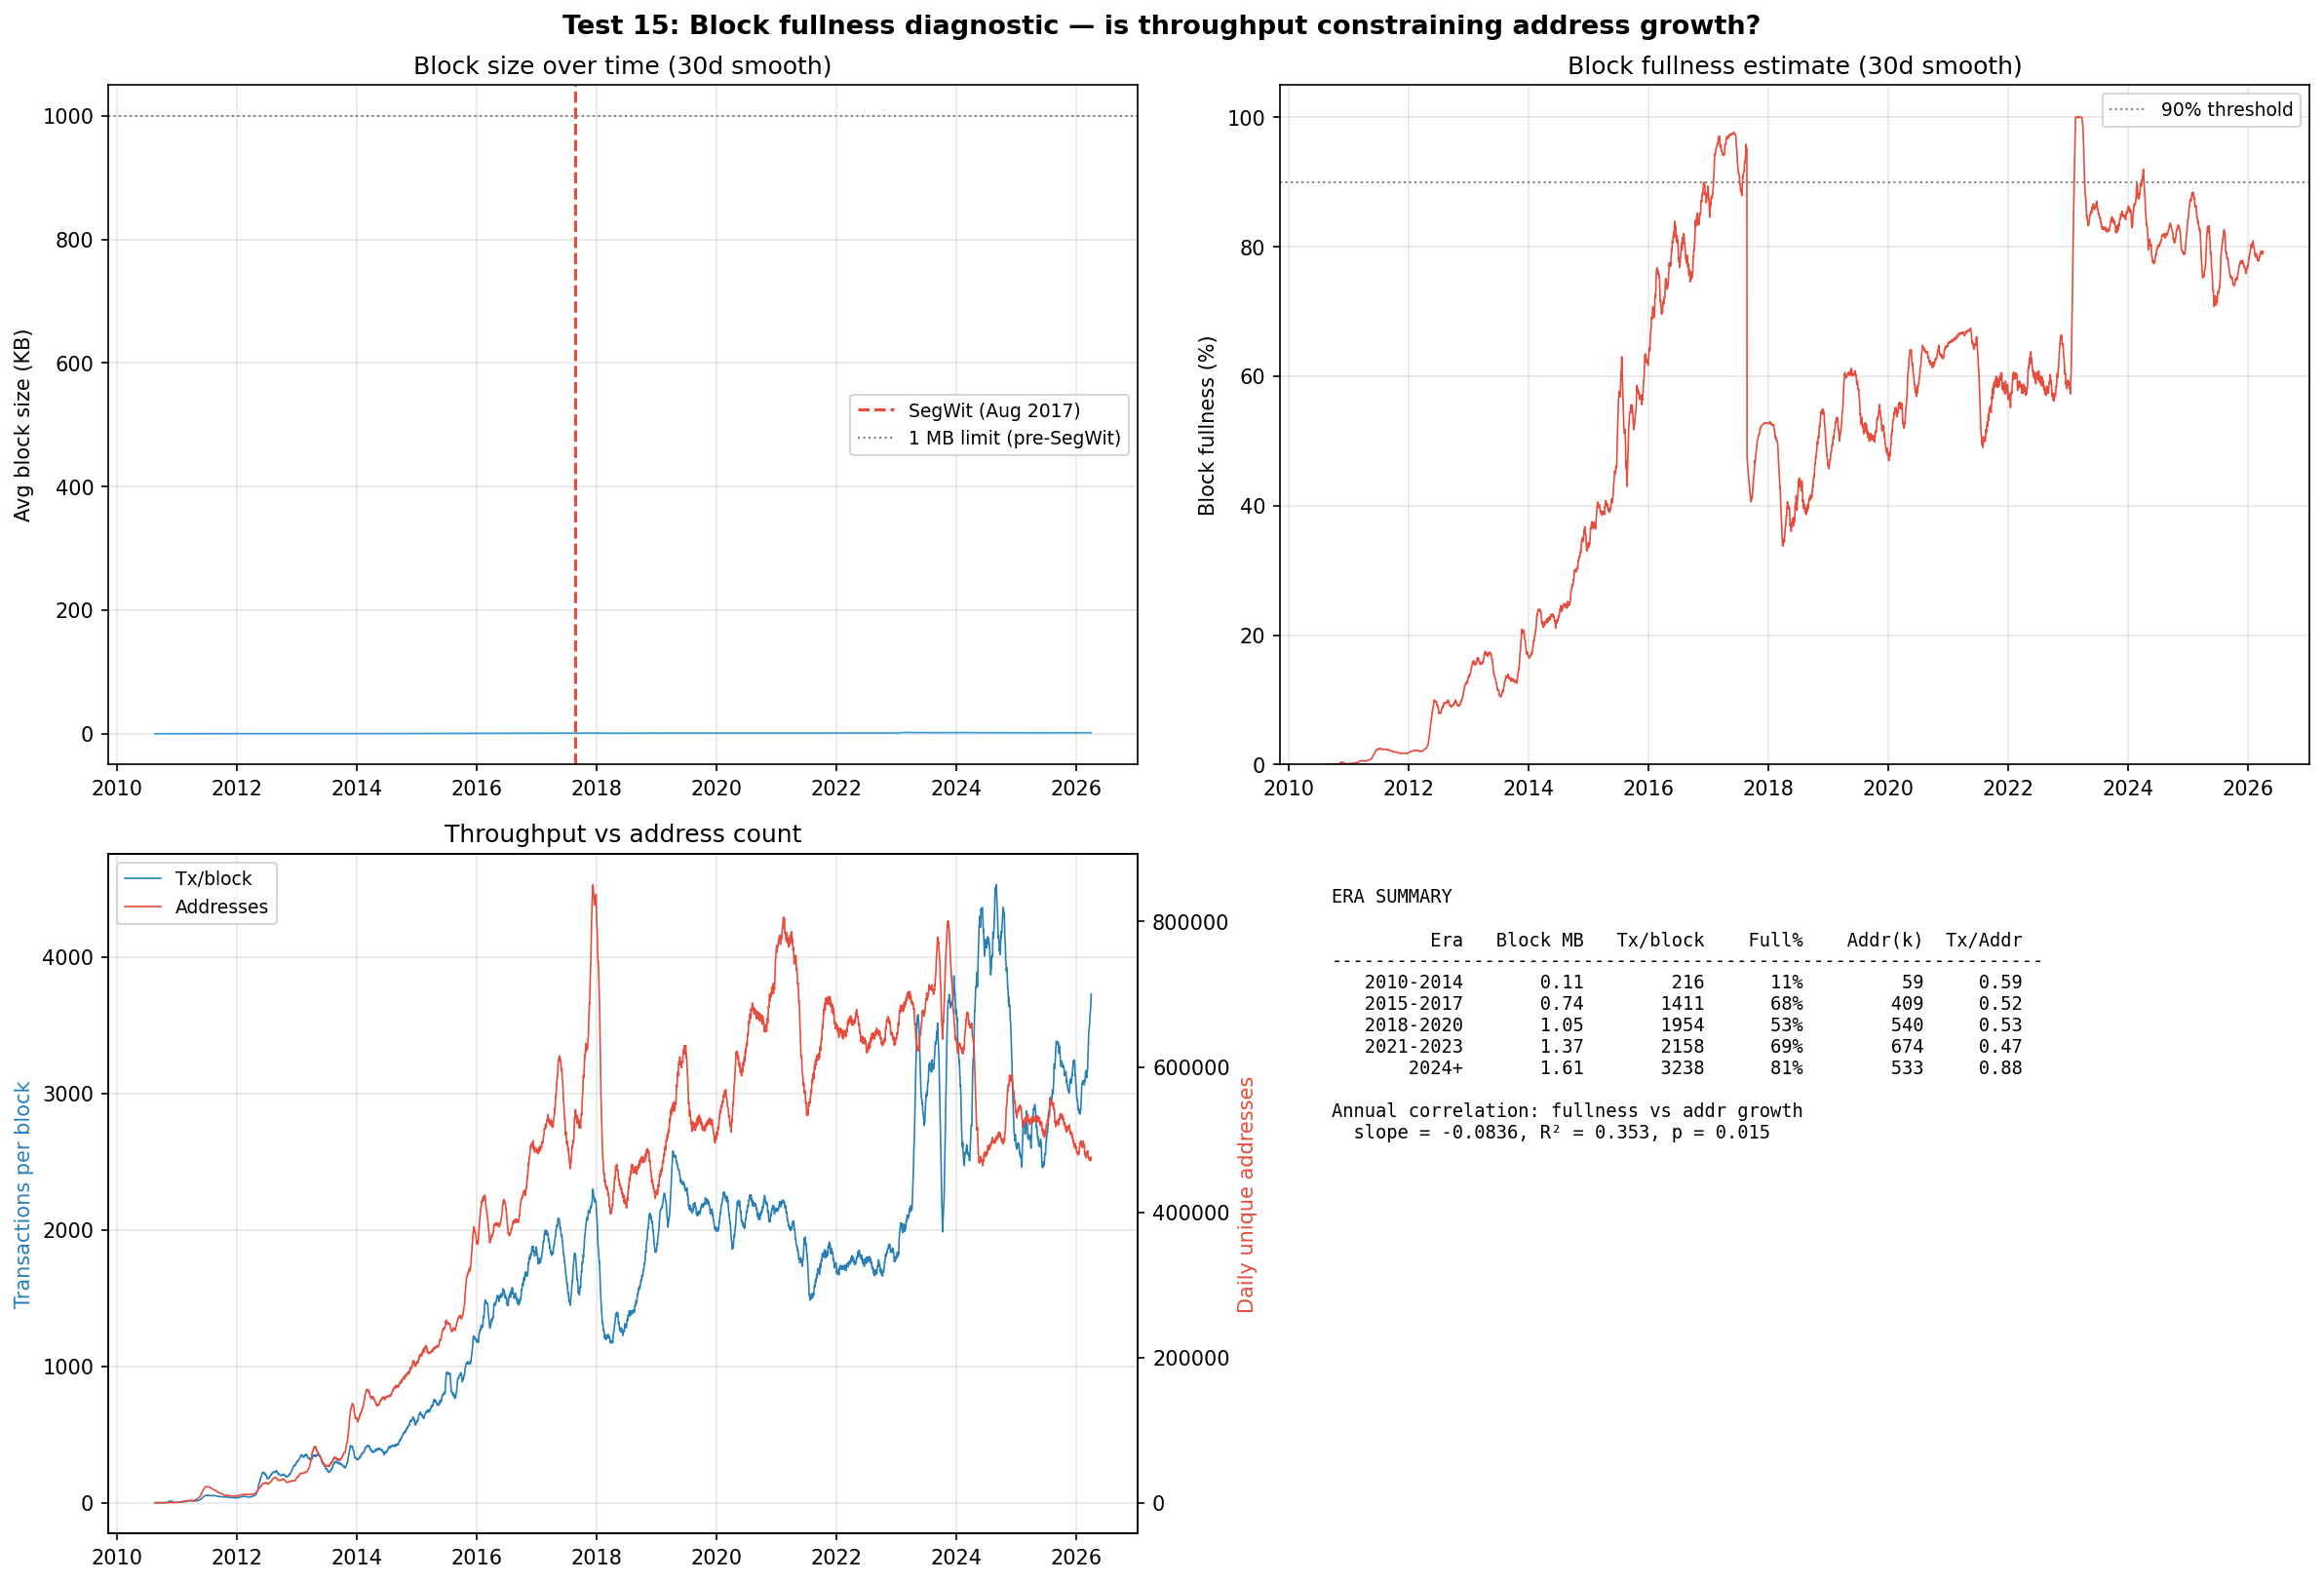
Block fullness figure
Test 15 corroborative
Block fullness
Full blocks (81% in 2024+) suppress address growth (p=0.015).
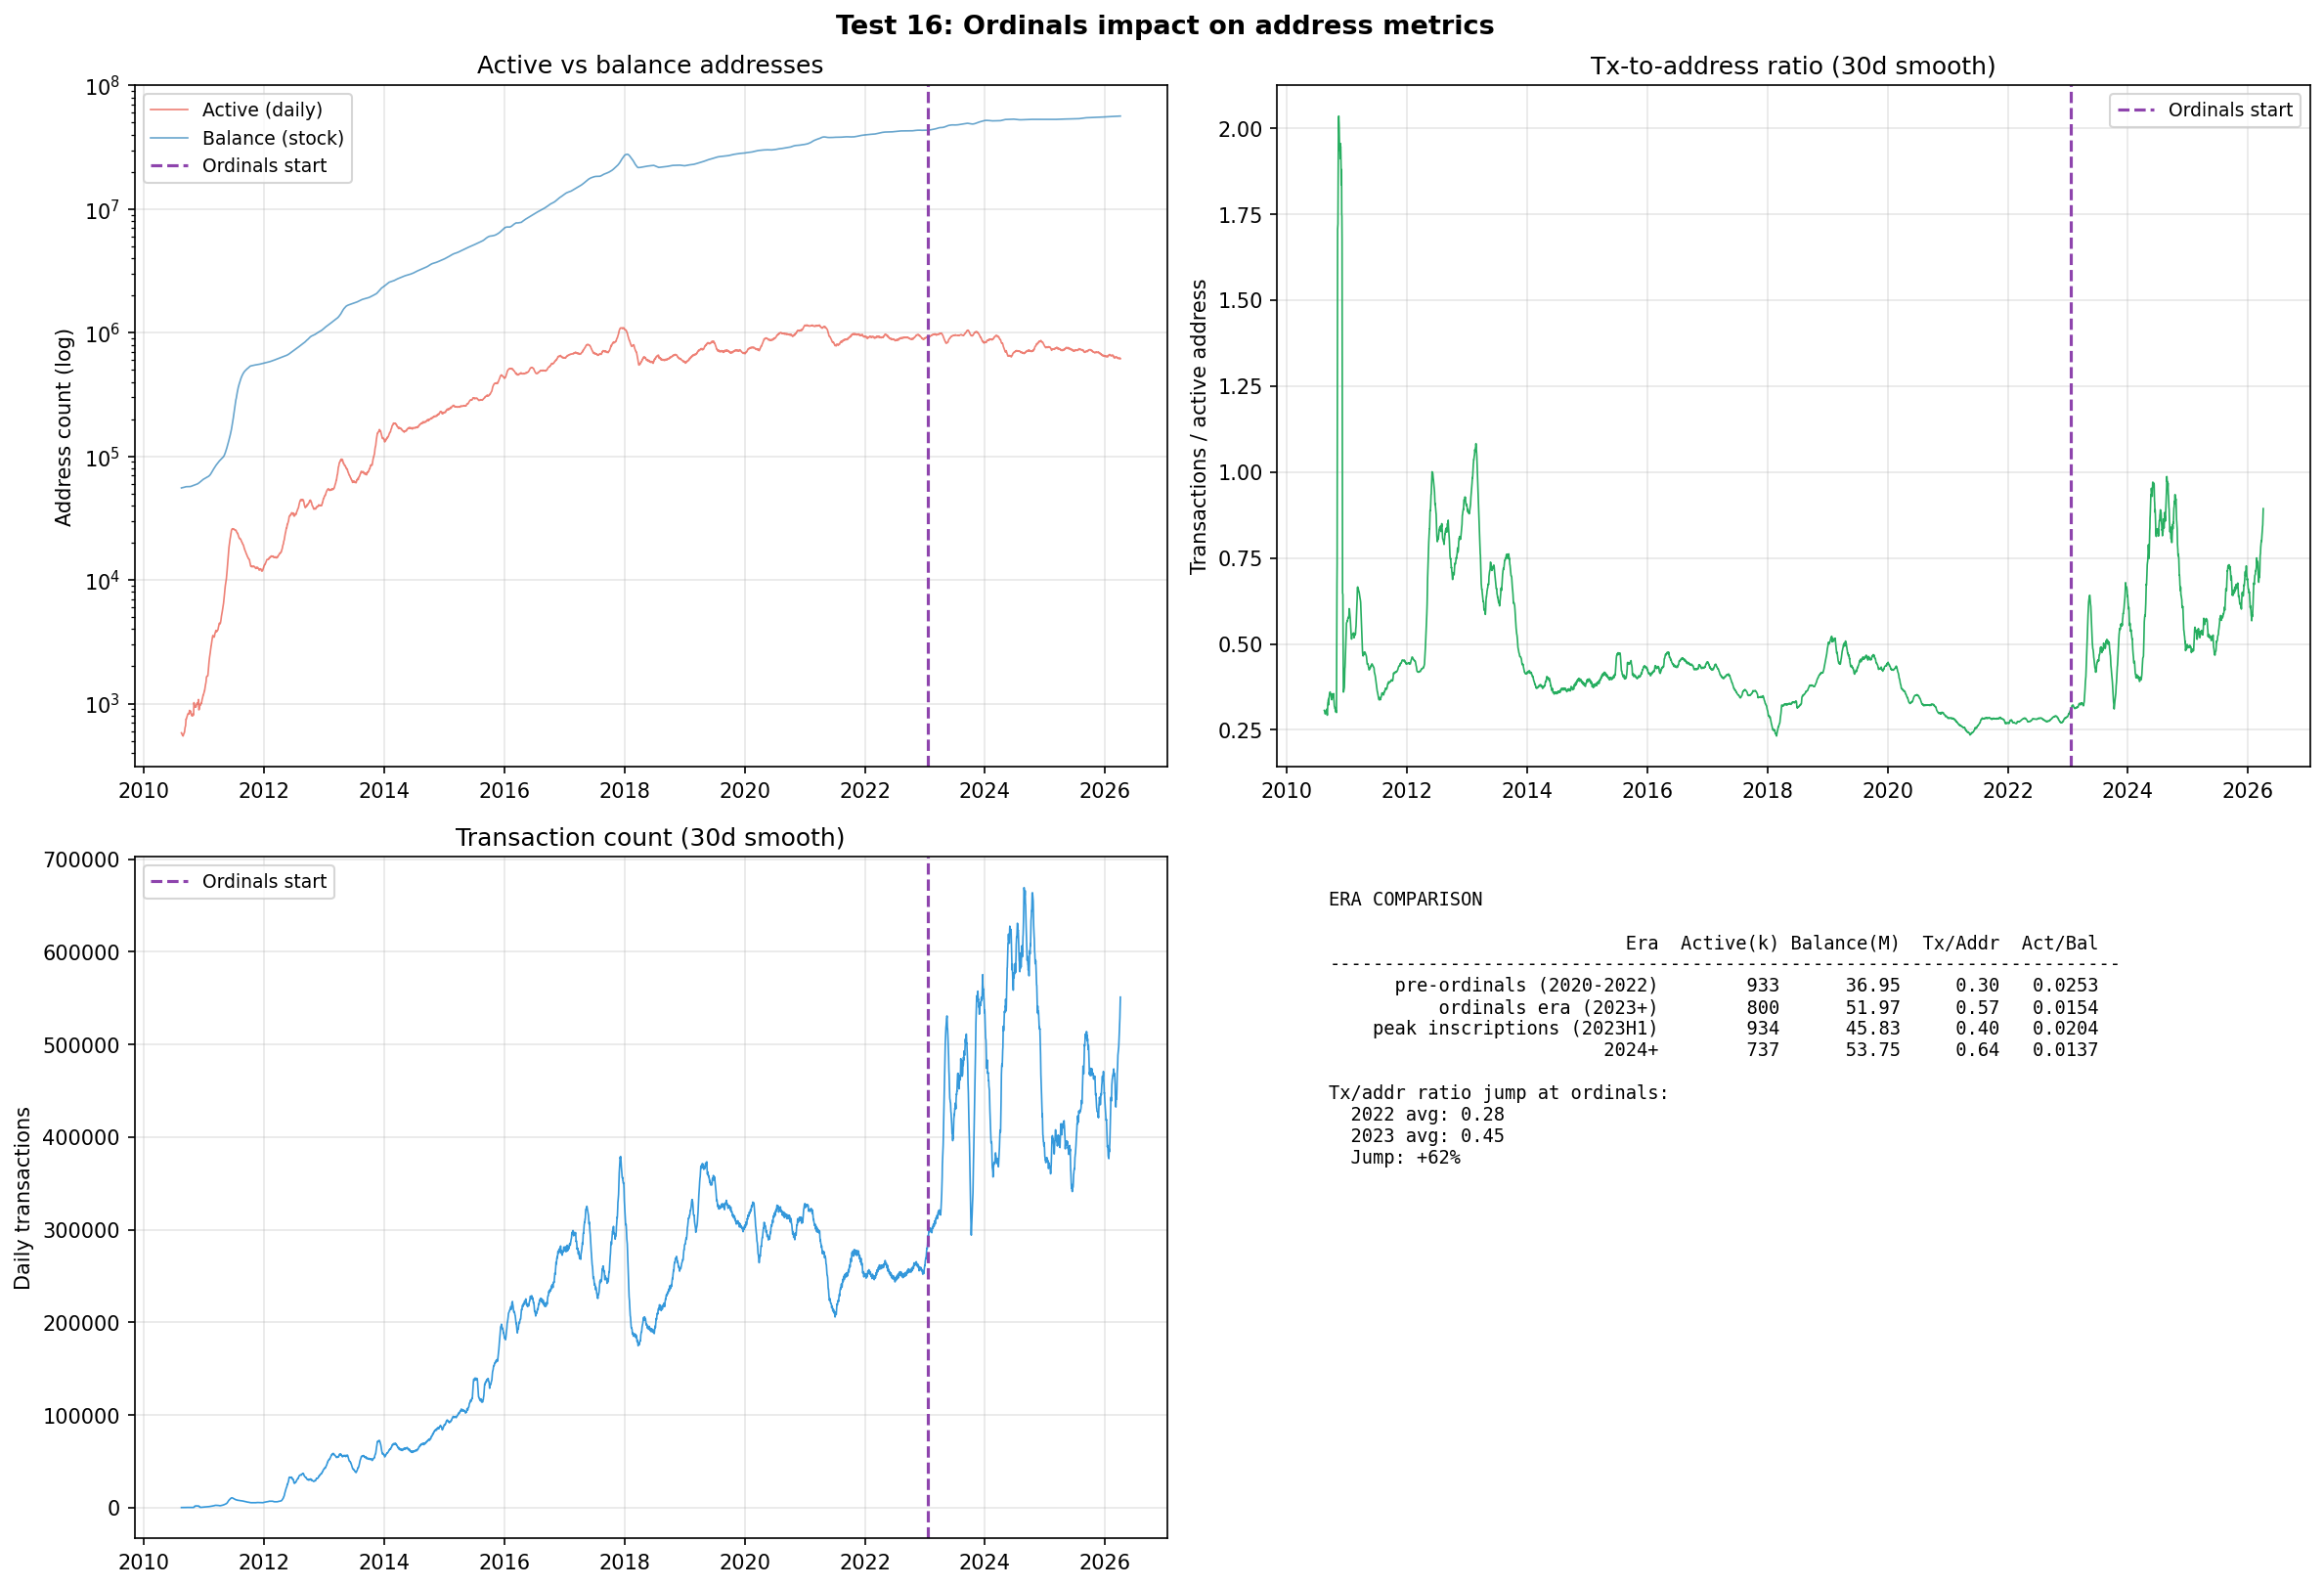
Ordinals figure
Test 16 corroborative
Ordinals
Inscriptions did not inflate address counts - they fell.
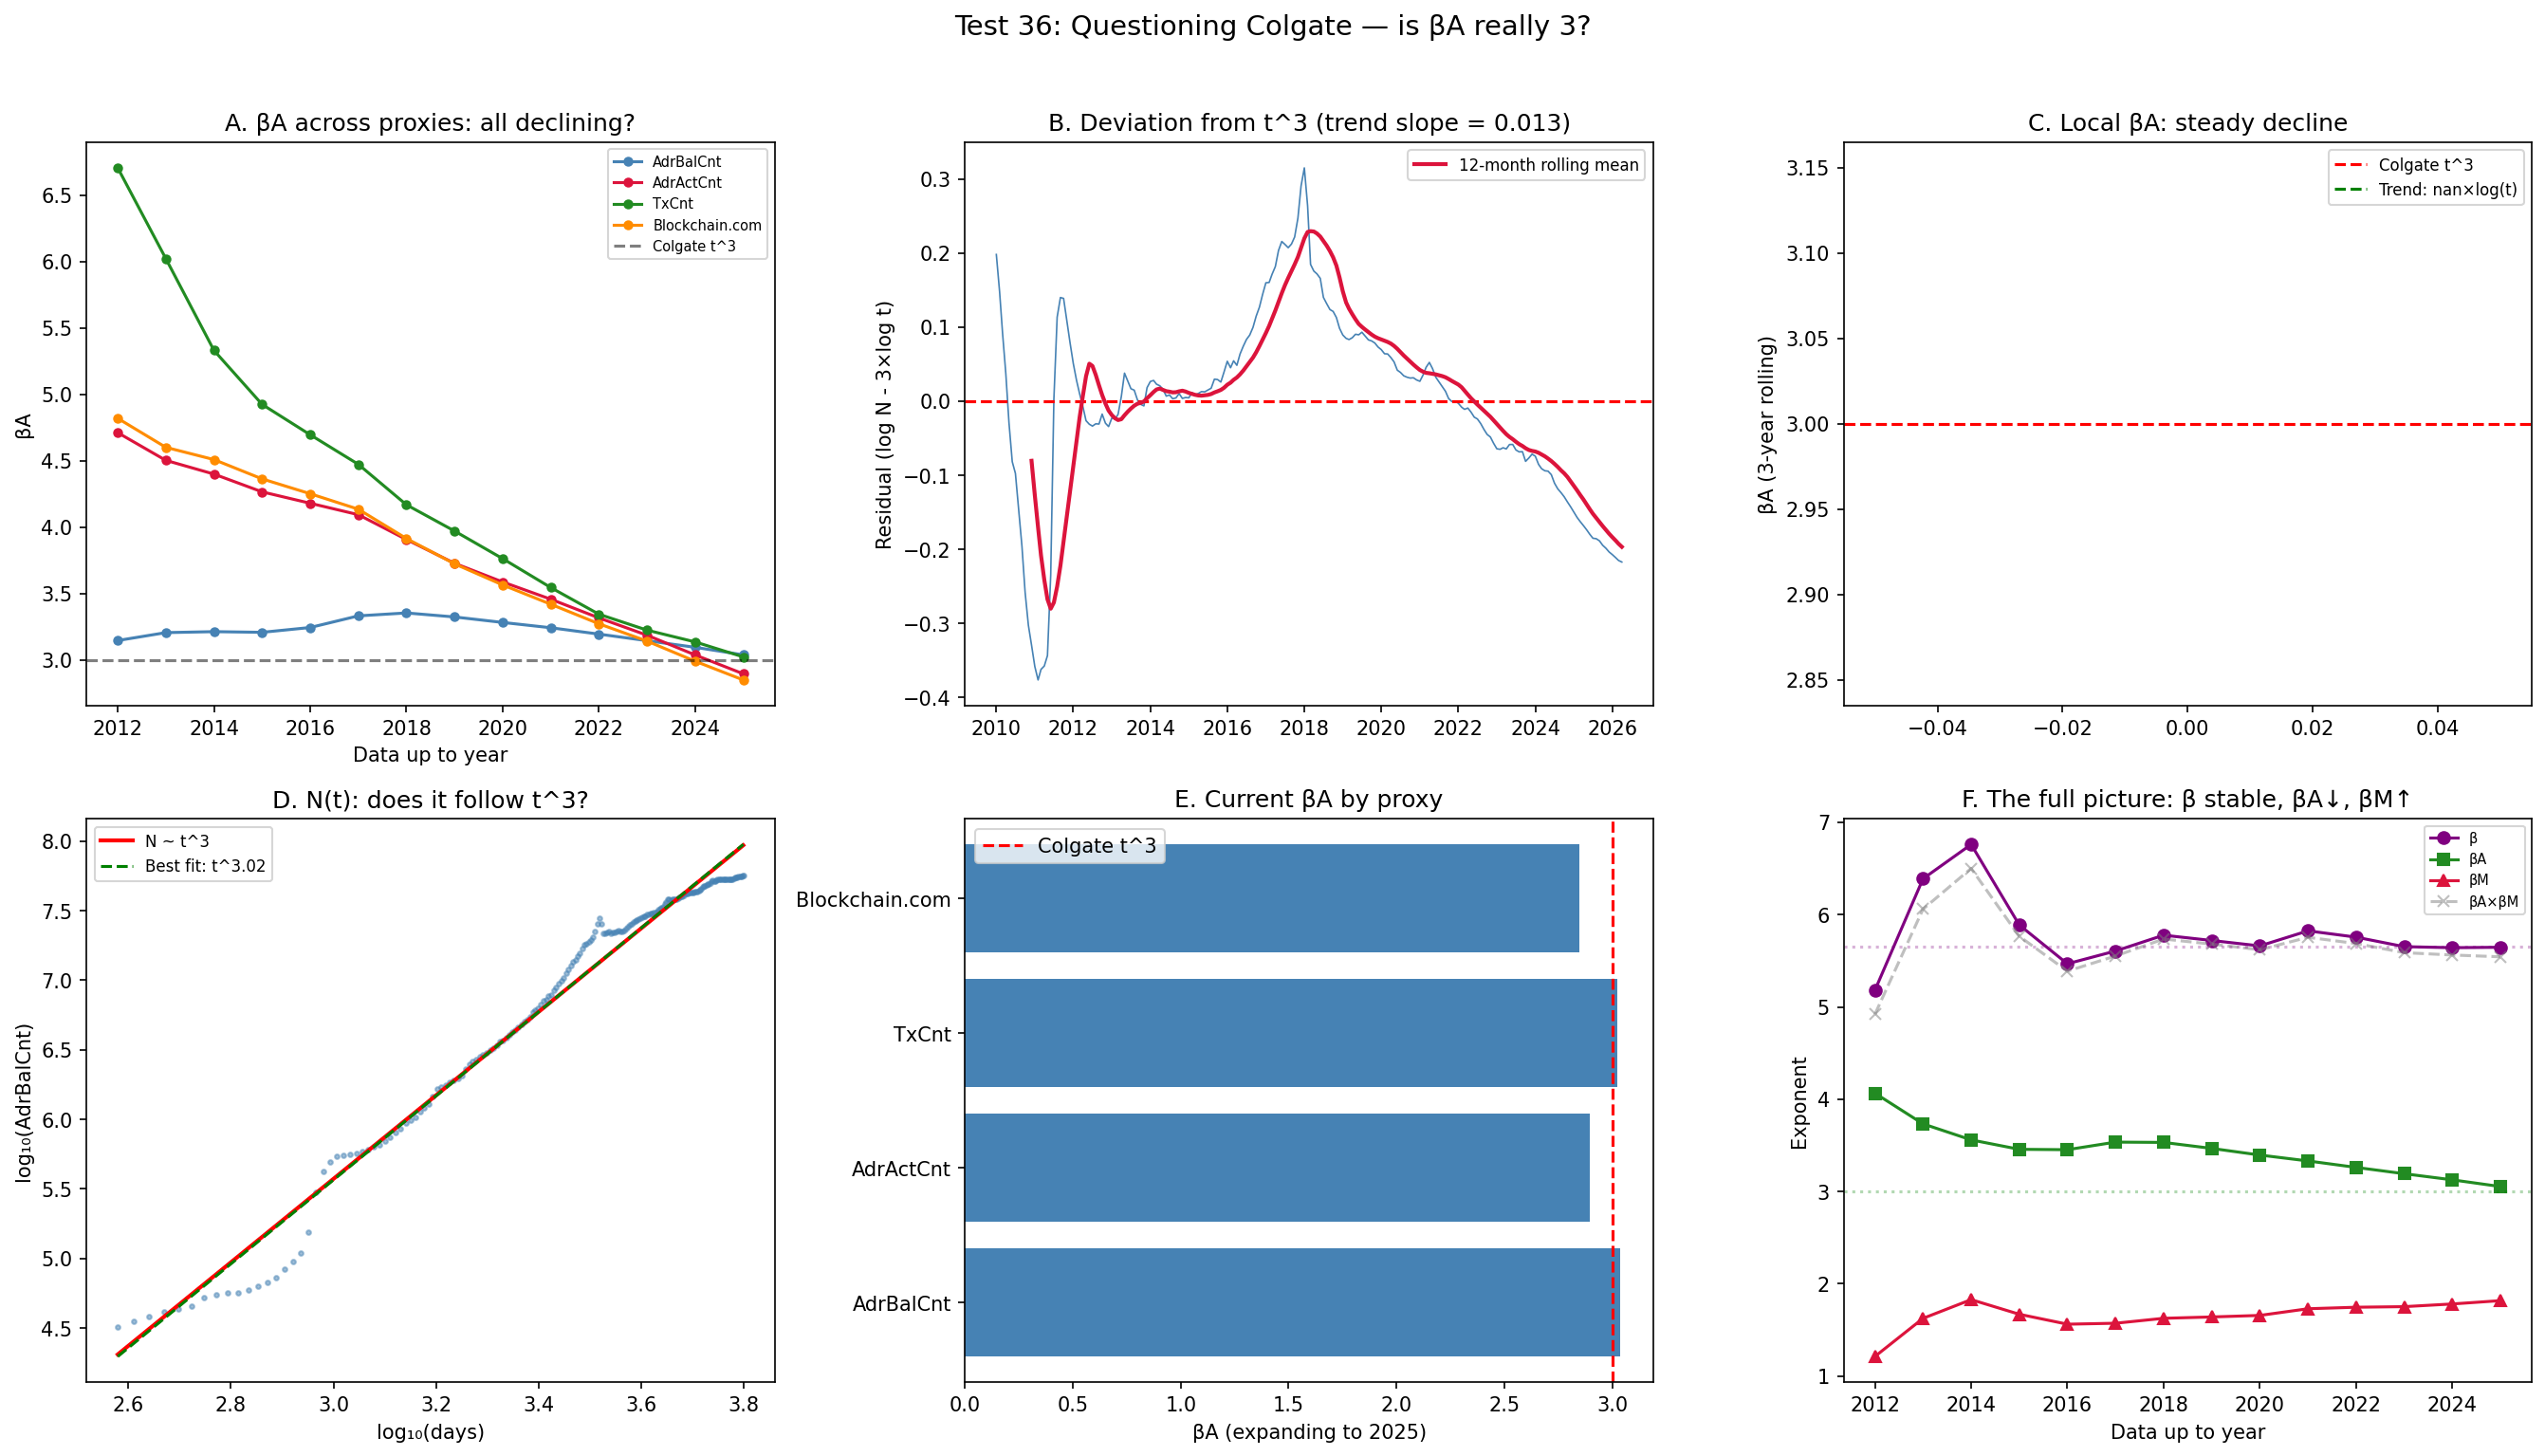
Questioning t³ figure
Test 36 ★ load-bearing
Questioning t³
t³ is not rejected (p = 0.68); proxy degradation undecidable.
documentary — no figure
Test 49 corroborative
UTXO gamma
UTXO balances measure wealth concentration, not network topology.
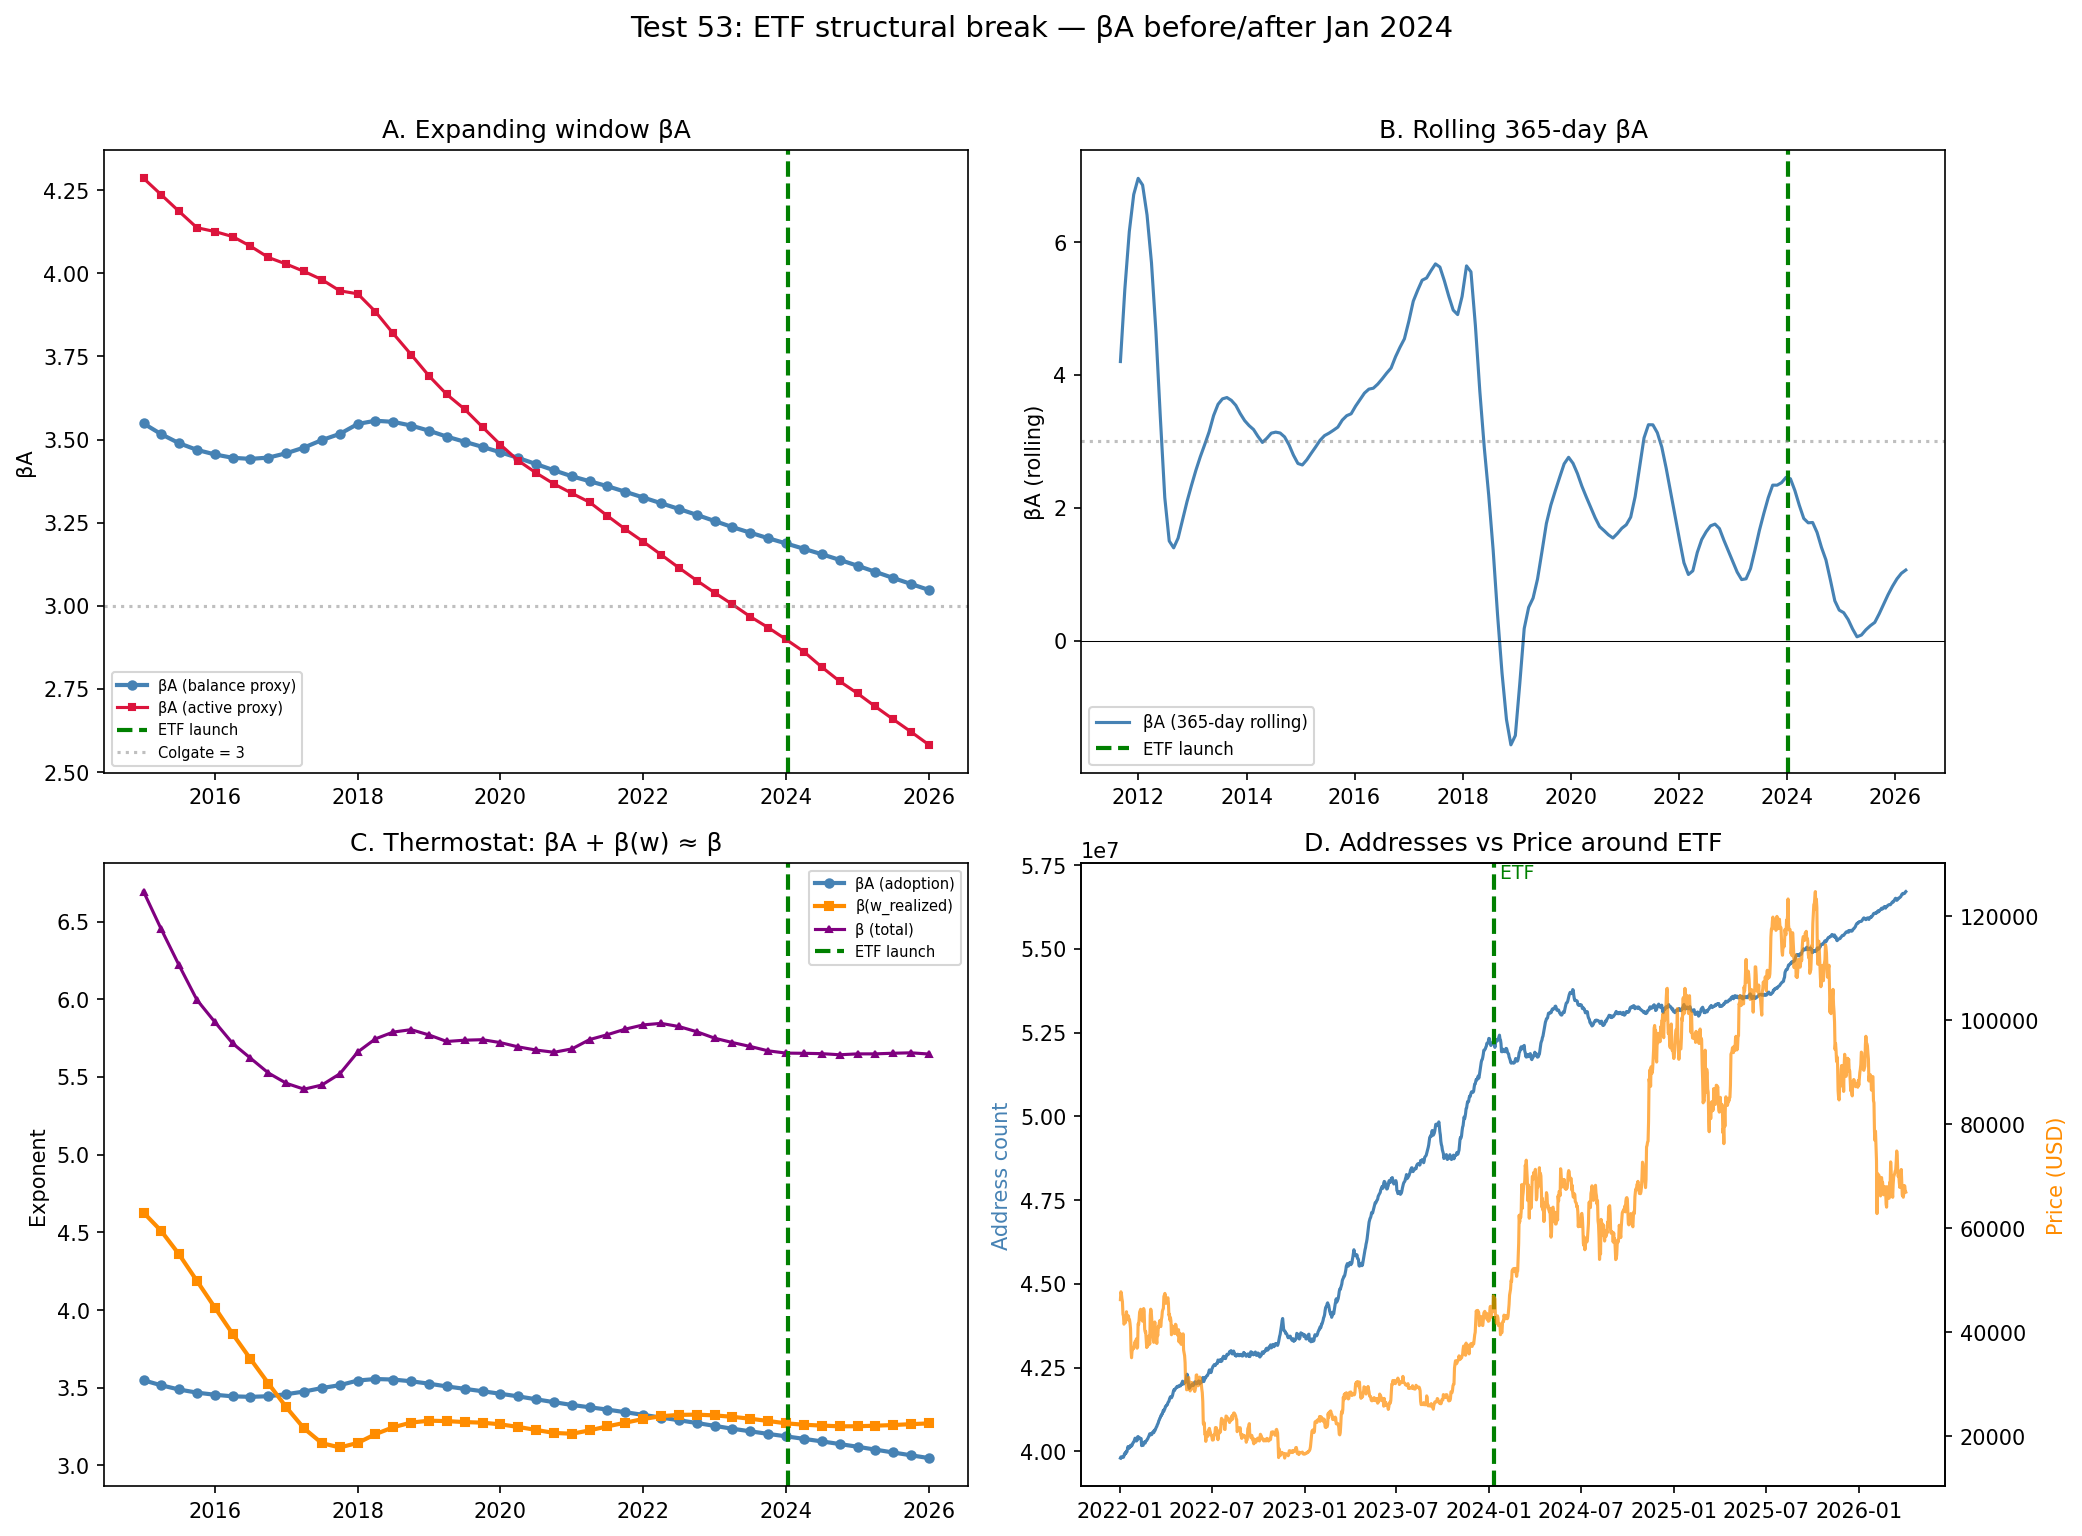
ETF structural break figure
Test 53 ★ load-bearing
ETF structural break
betaA collapses 3.19 to 0.55 post-ETF; beta stays at 5.65.

Model mechanics

Multifactor model figure
Test 14 corroborative
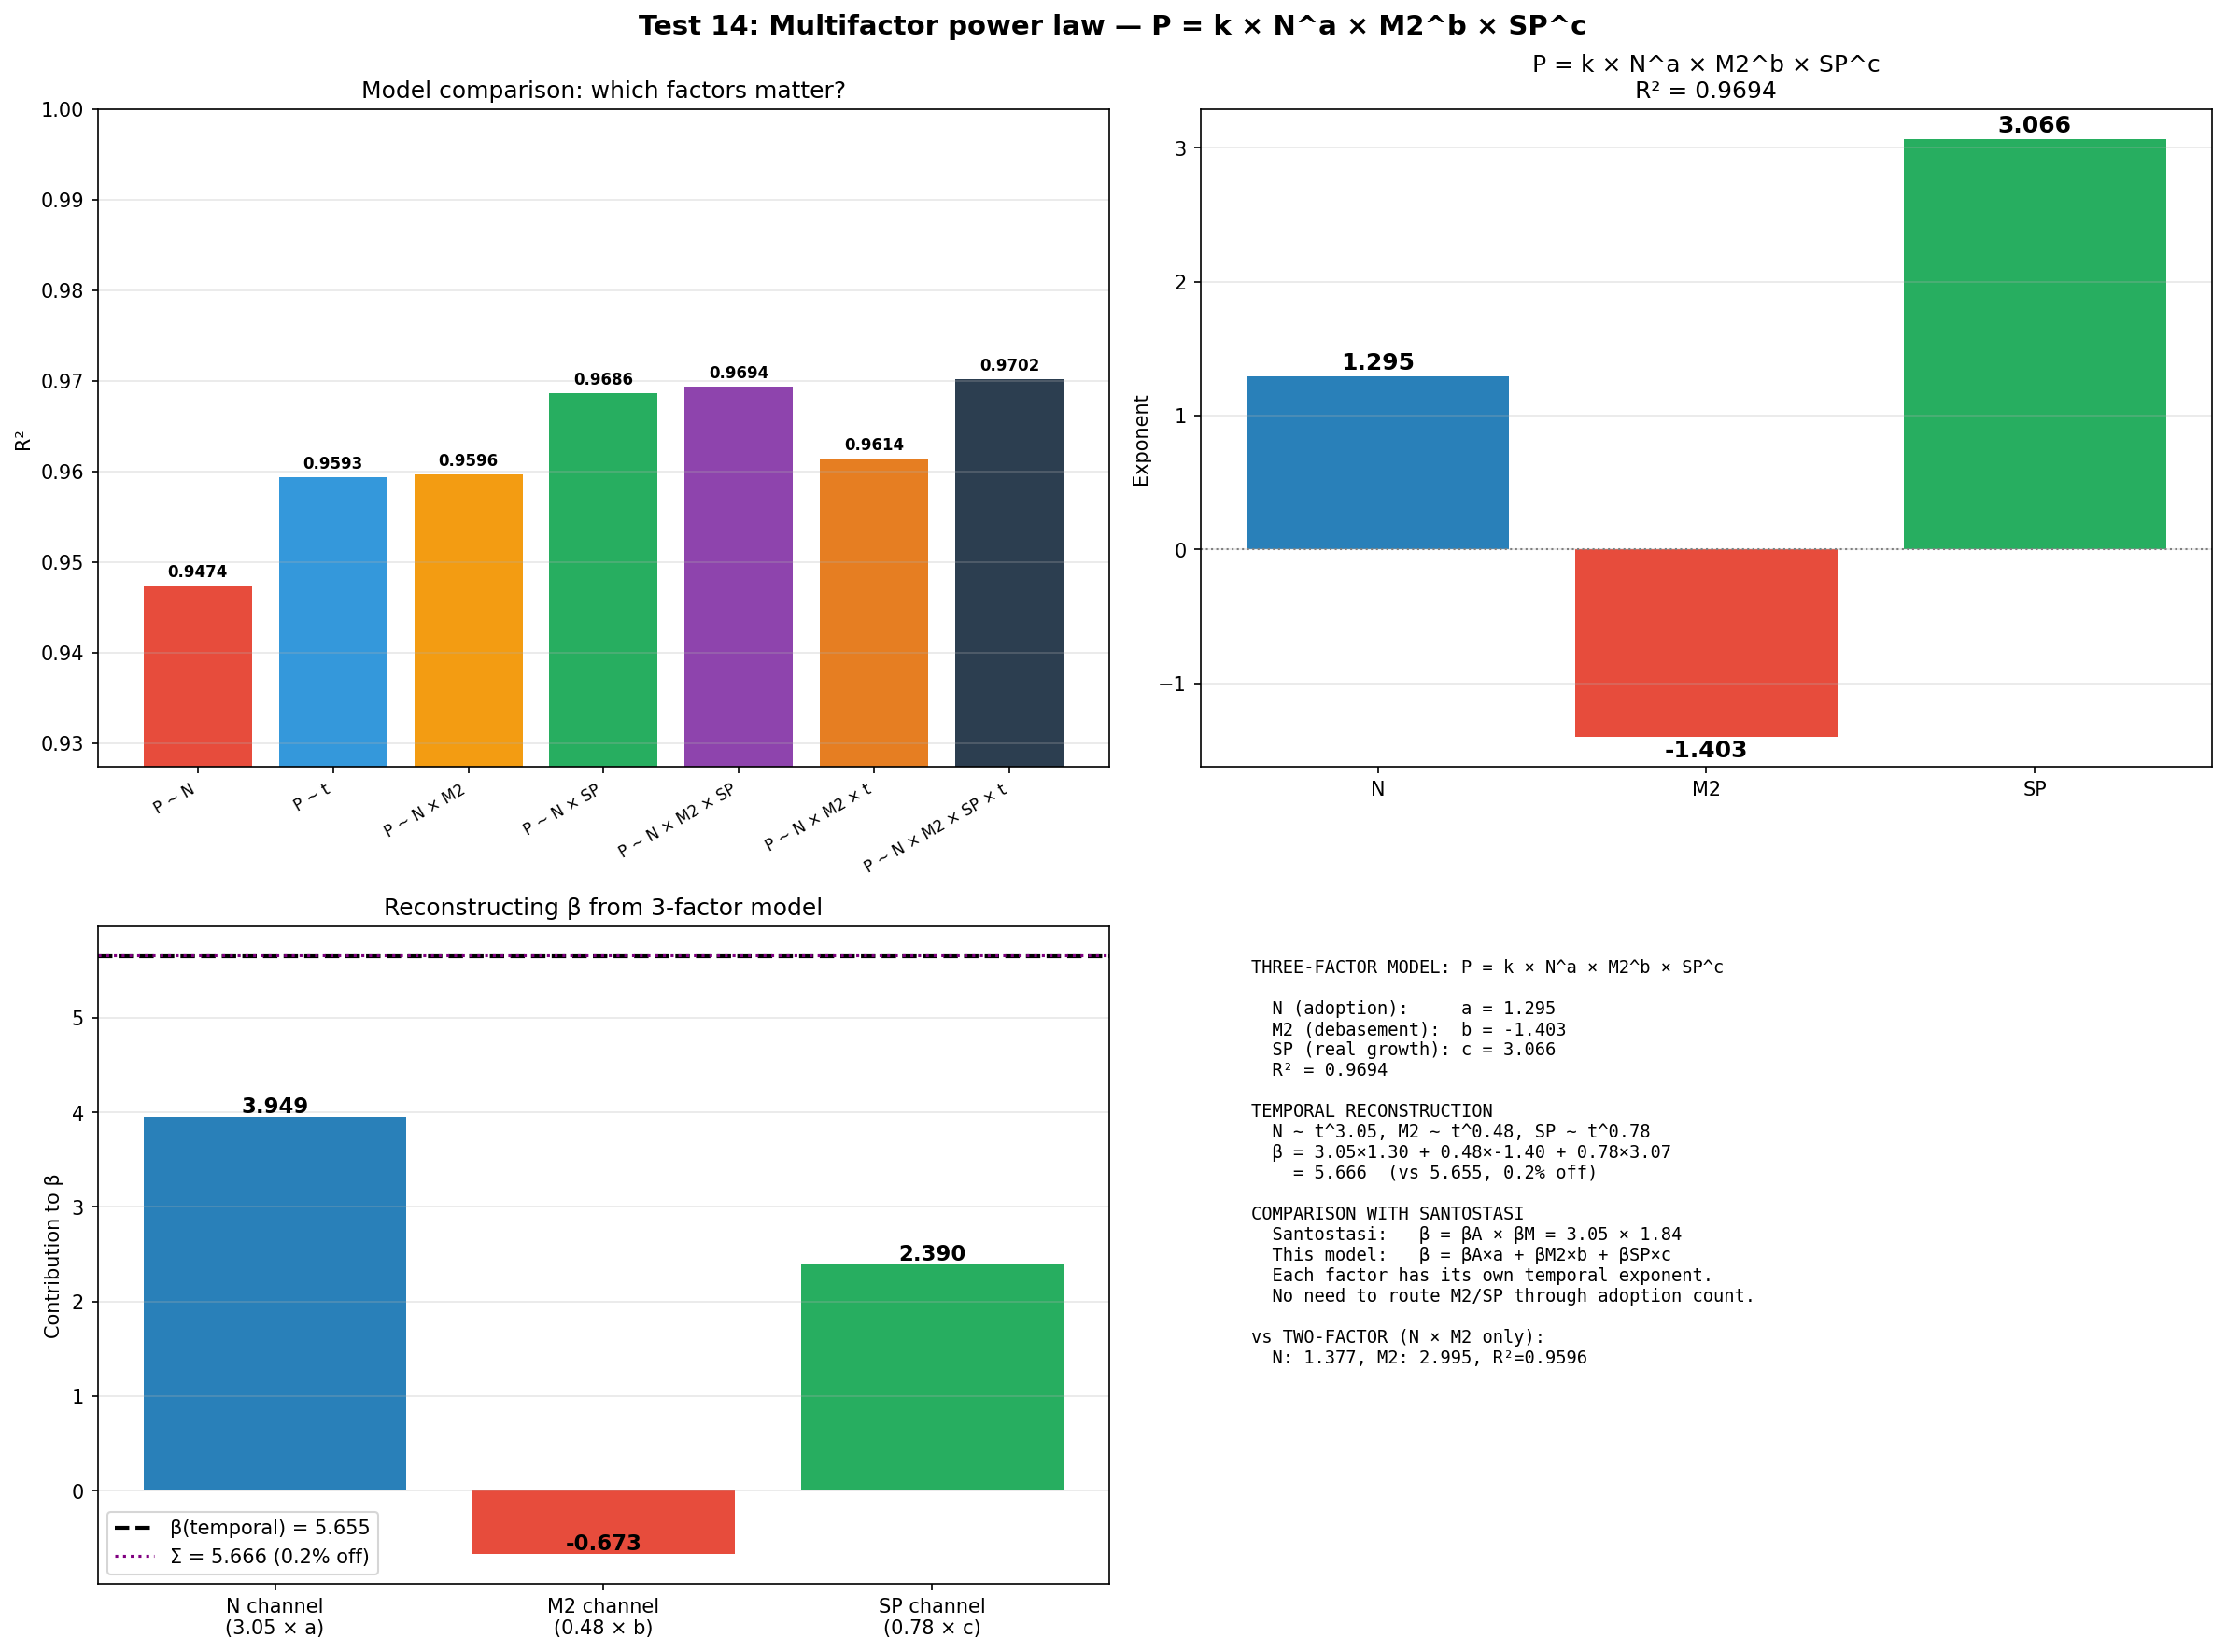
Multifactor model
P ~ N^1.26 x SP^2.35 fits best (R² 0.969) - but see Test 18.
Coefficient stability figure
Test 18 ★ load-bearing
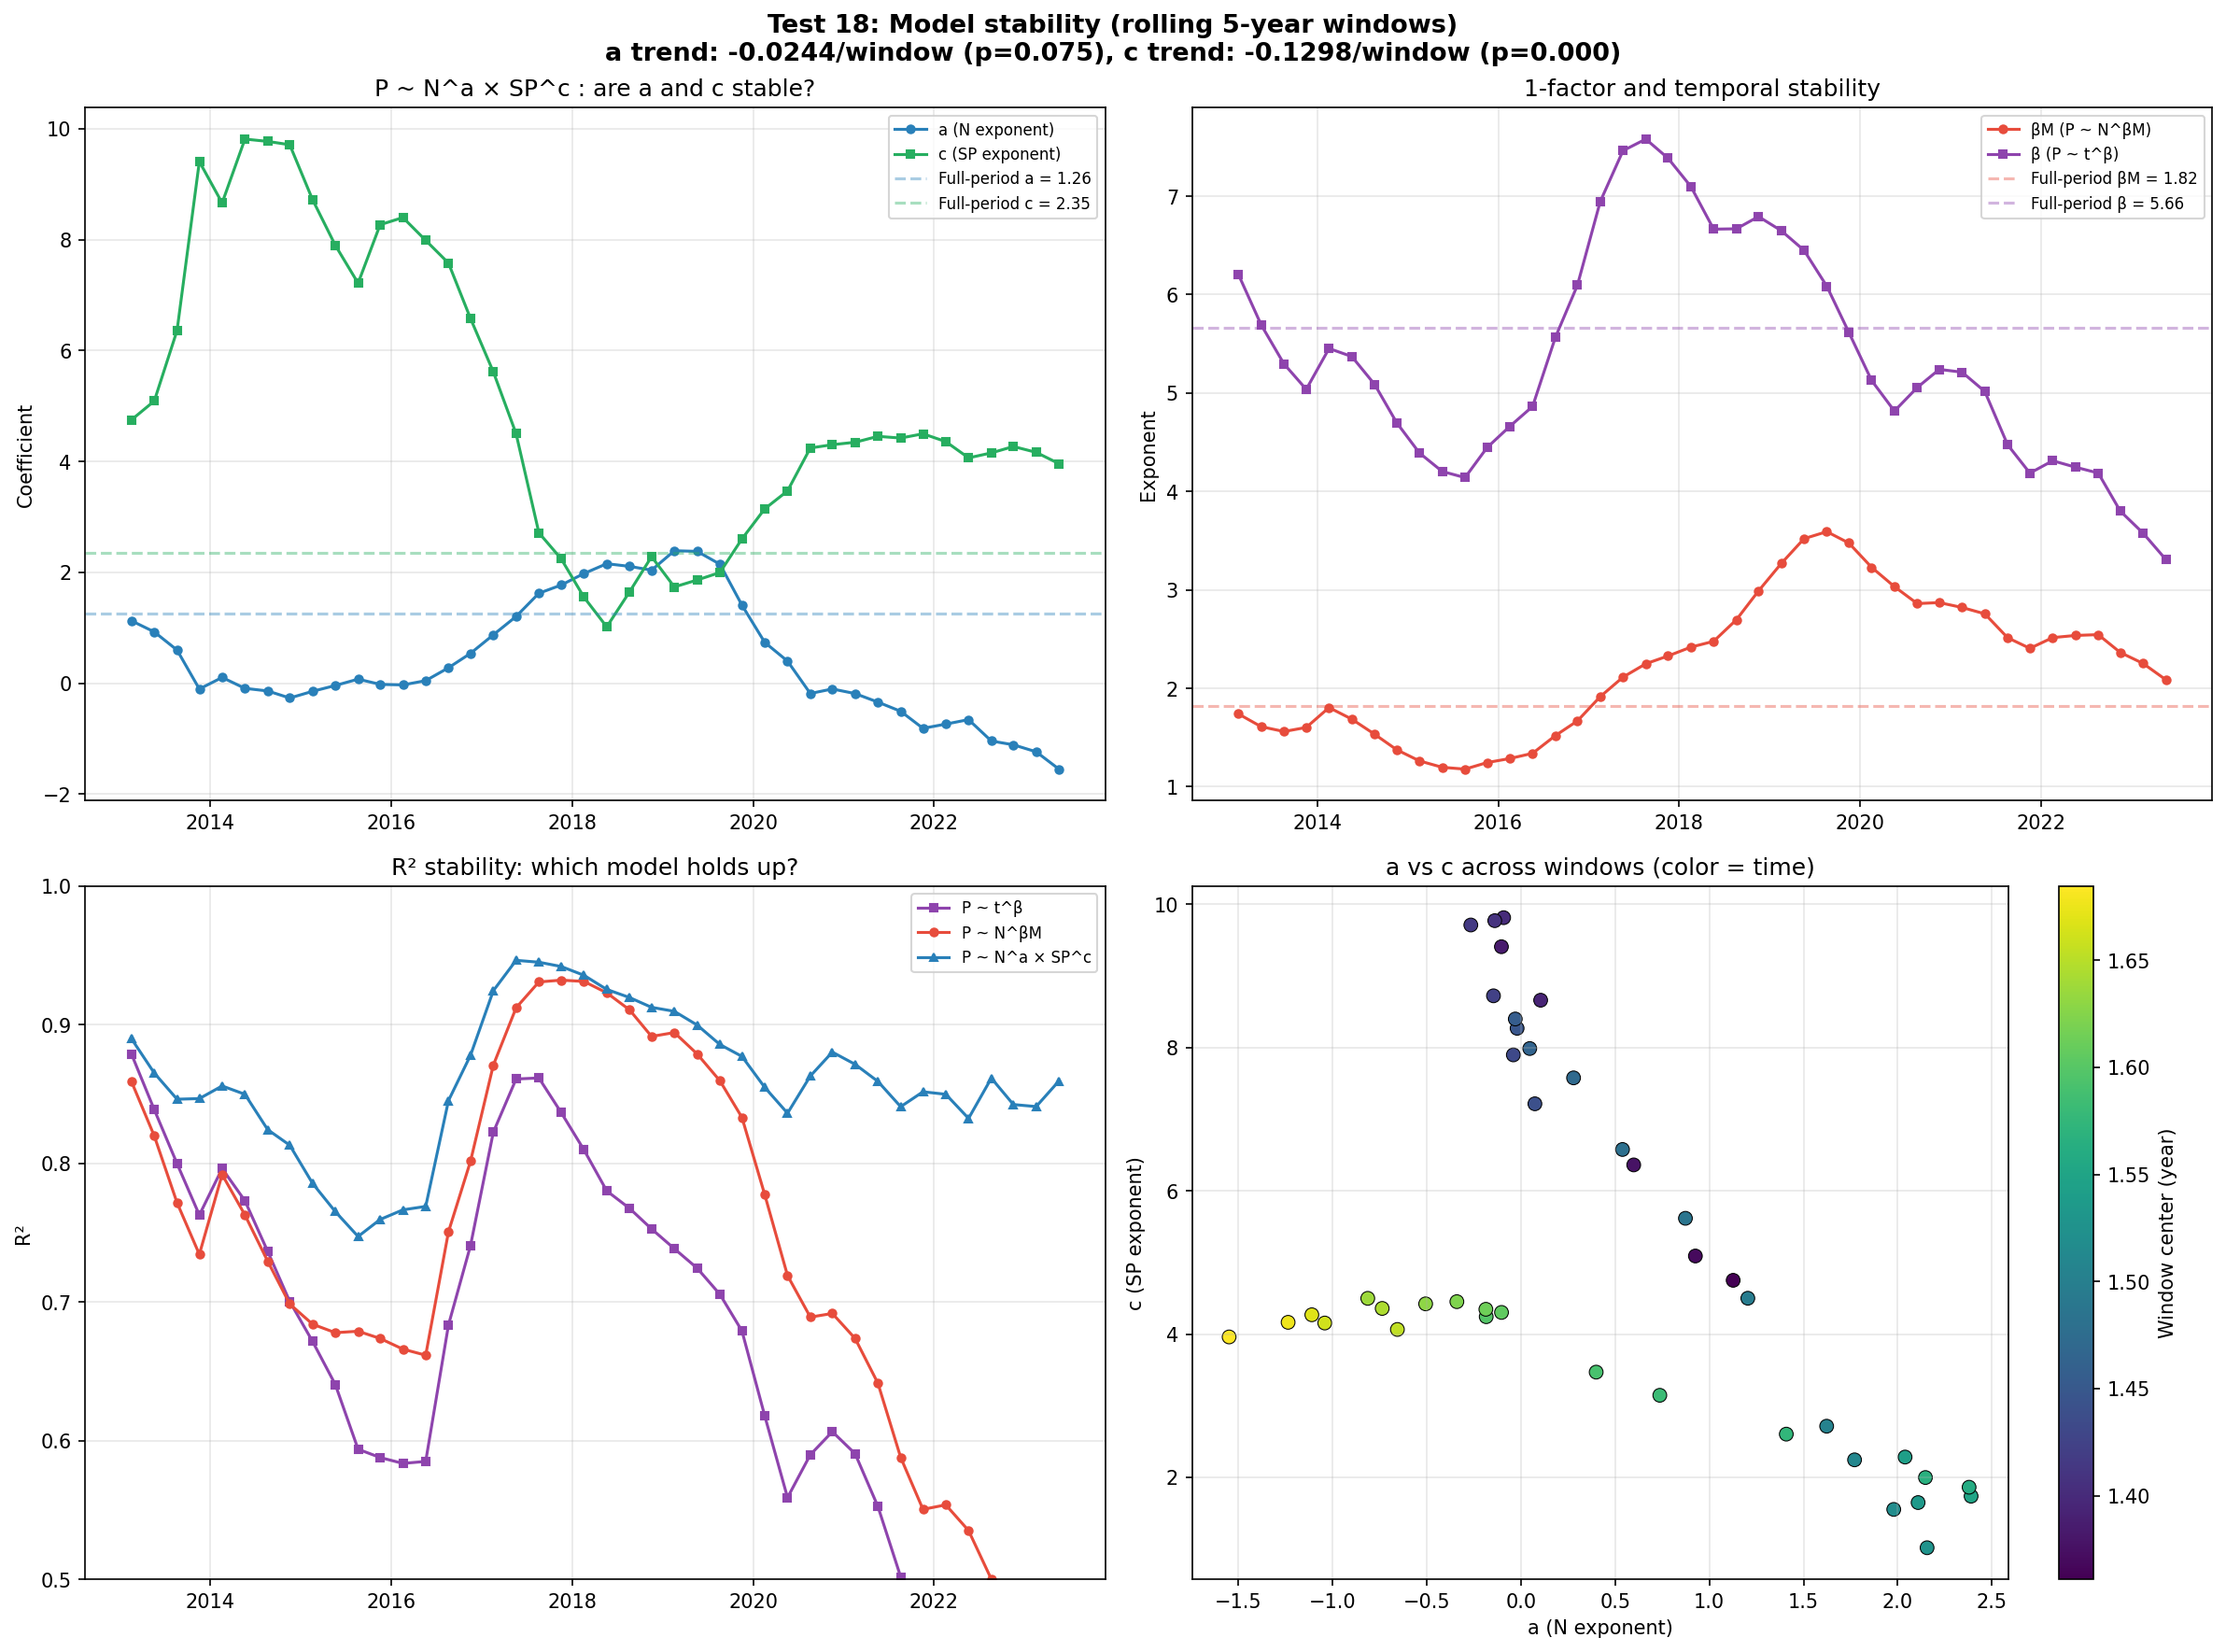
Coefficient stability
Multifactor coefficients are unstable (CV 258%); the temporal law wins.
Factorisation stability figure
Test 21 ★ load-bearing
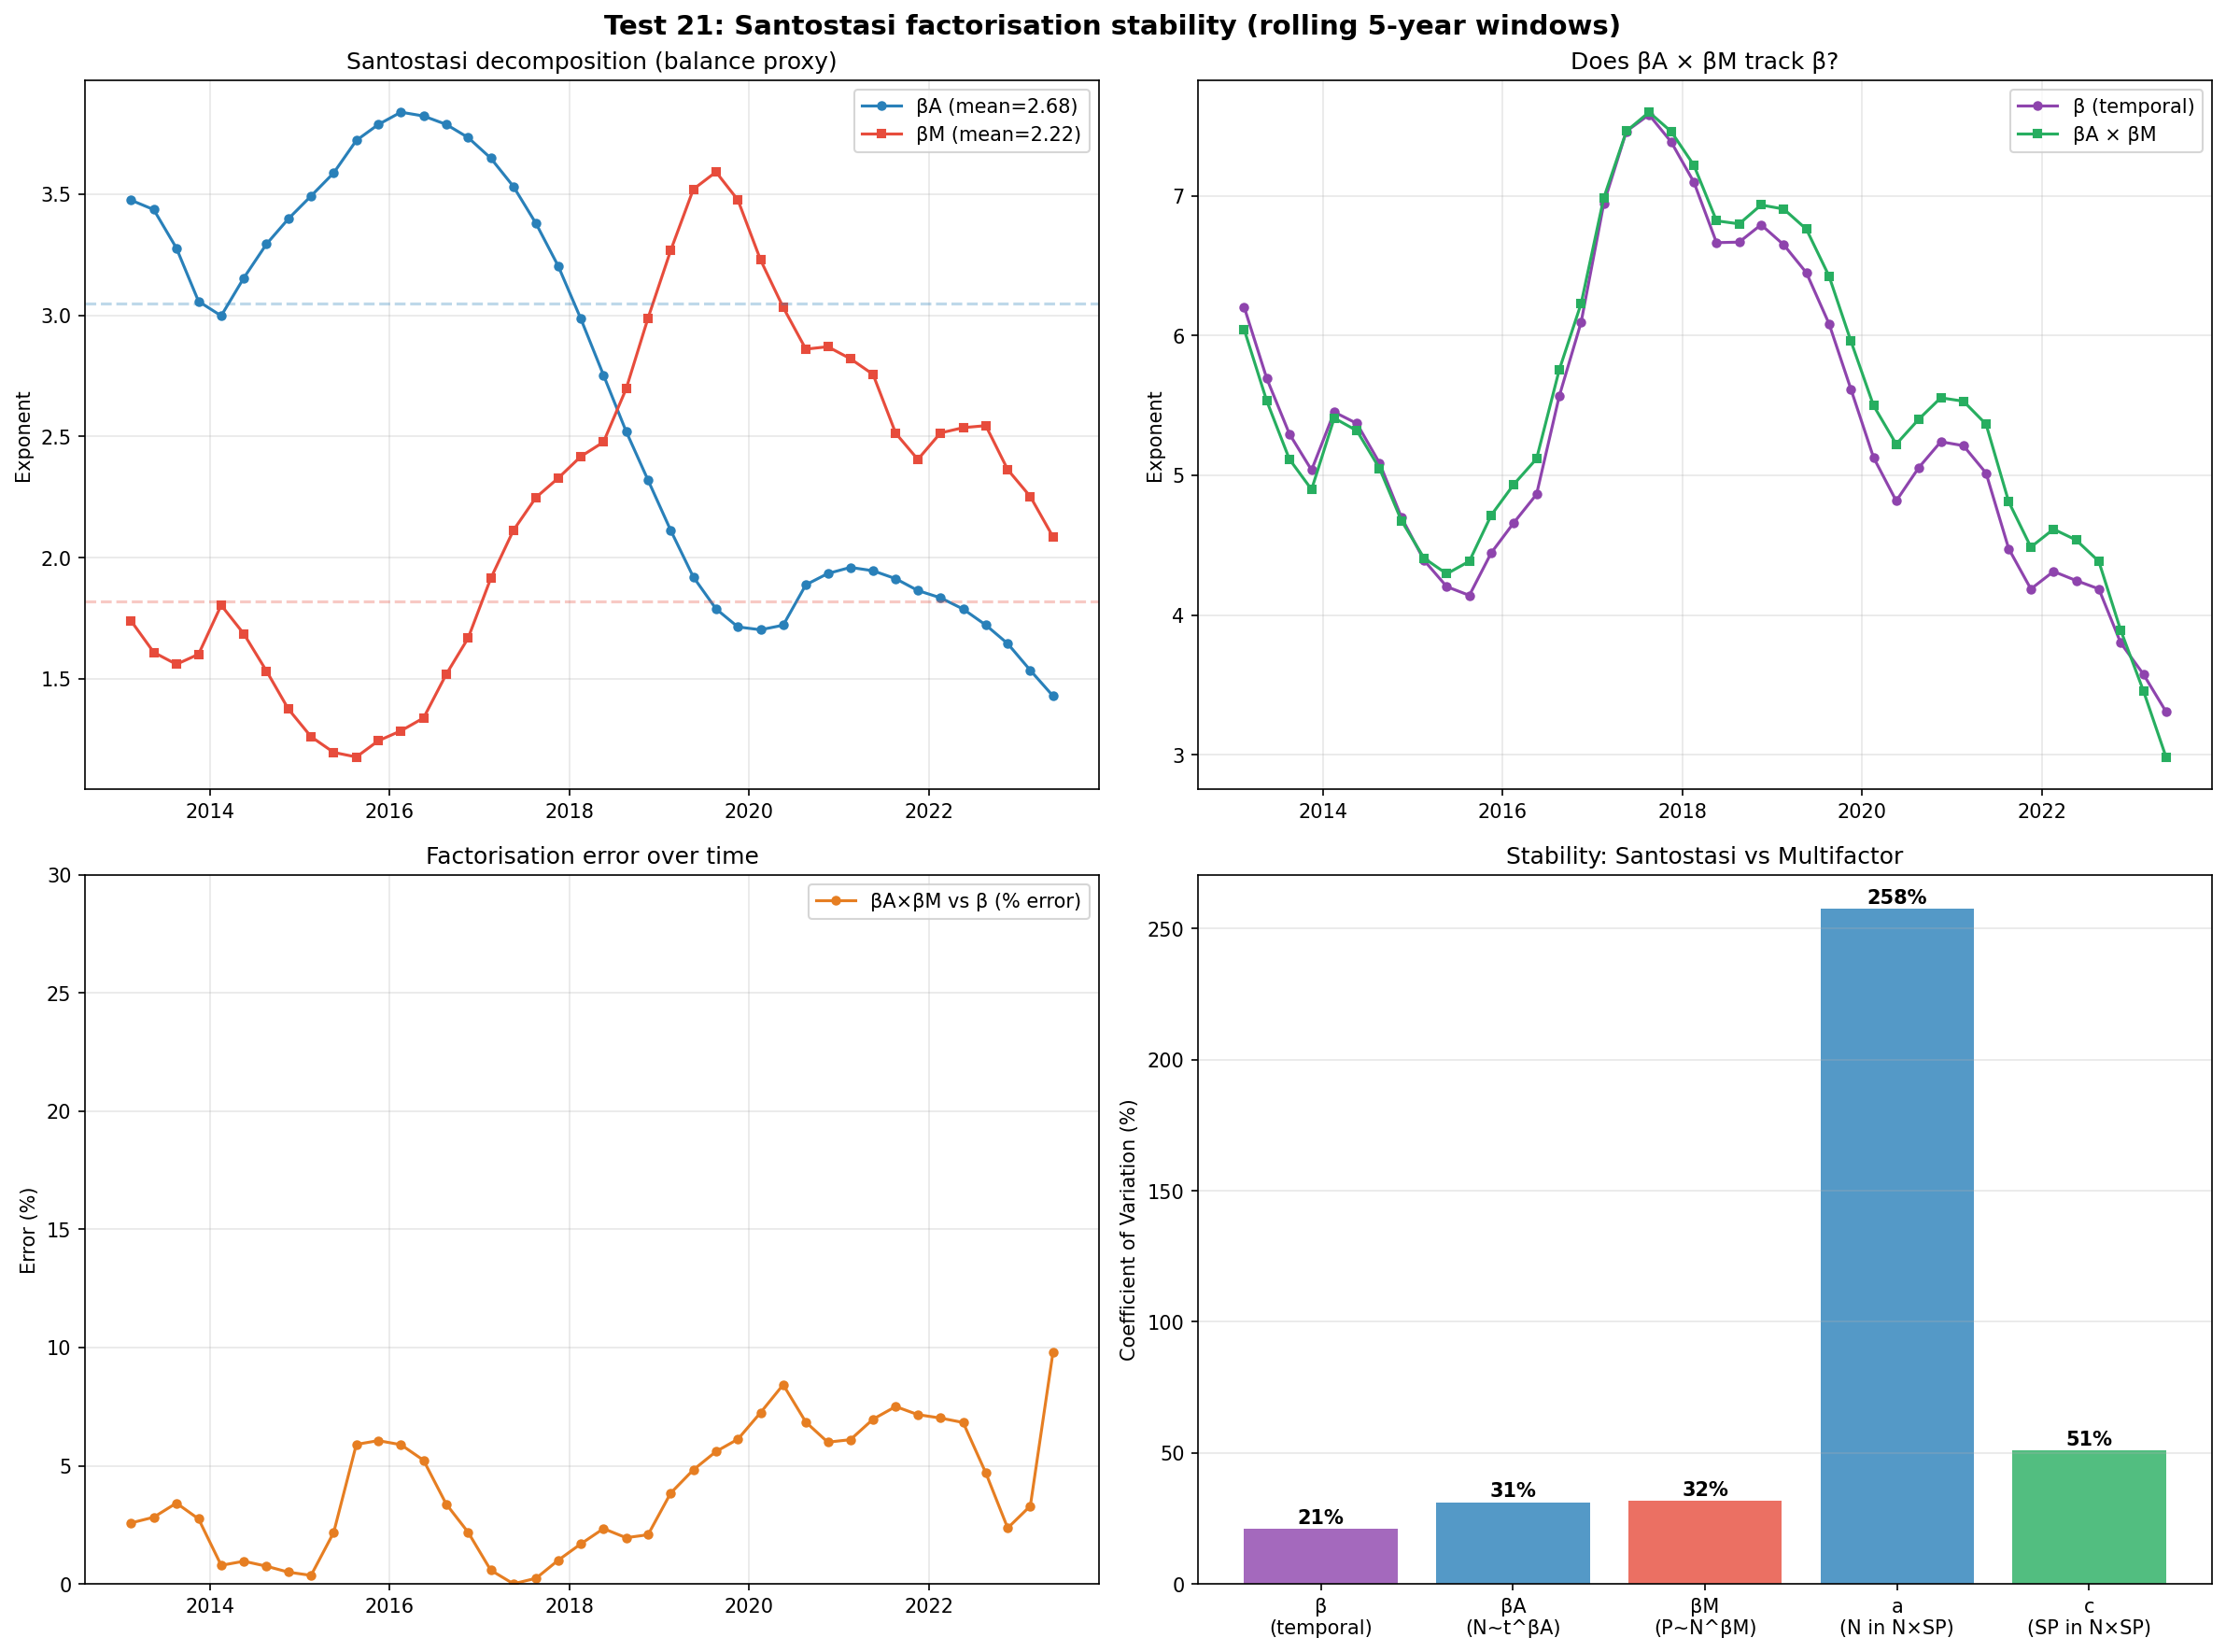
Factorisation stability
beta = betaA x betaM: product stable (4%), components drift.
w(t) decomposition figure
Test 28 corroborative
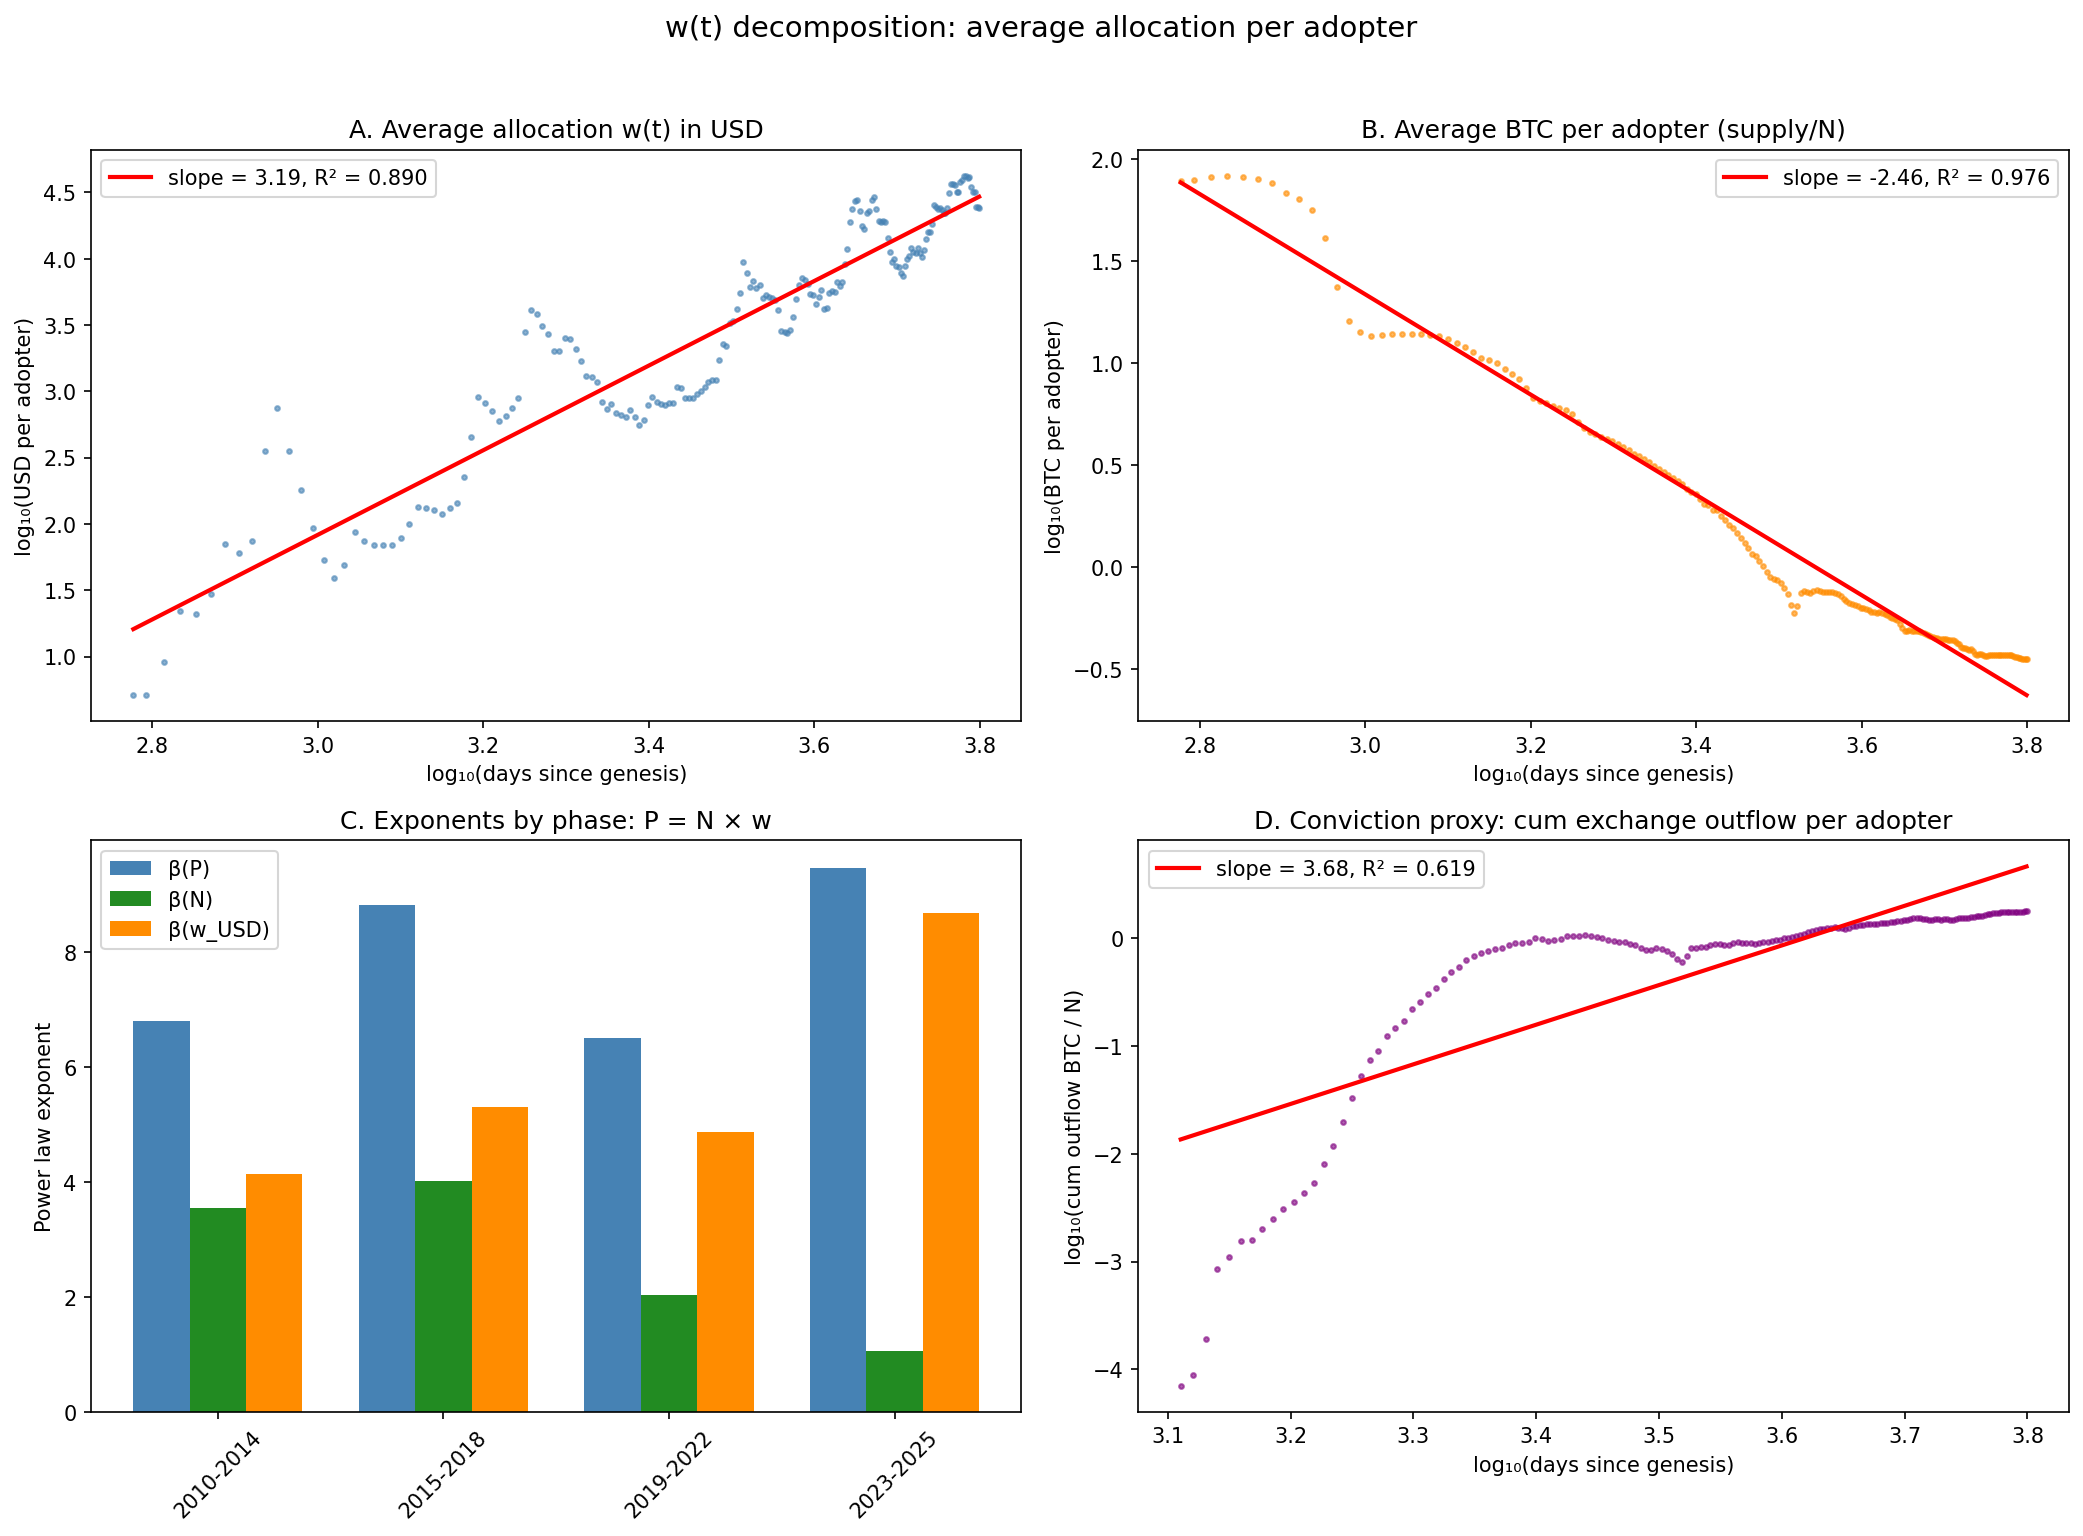
w(t) decomposition
Capital per adopter grows as t^3.19; regime change found.
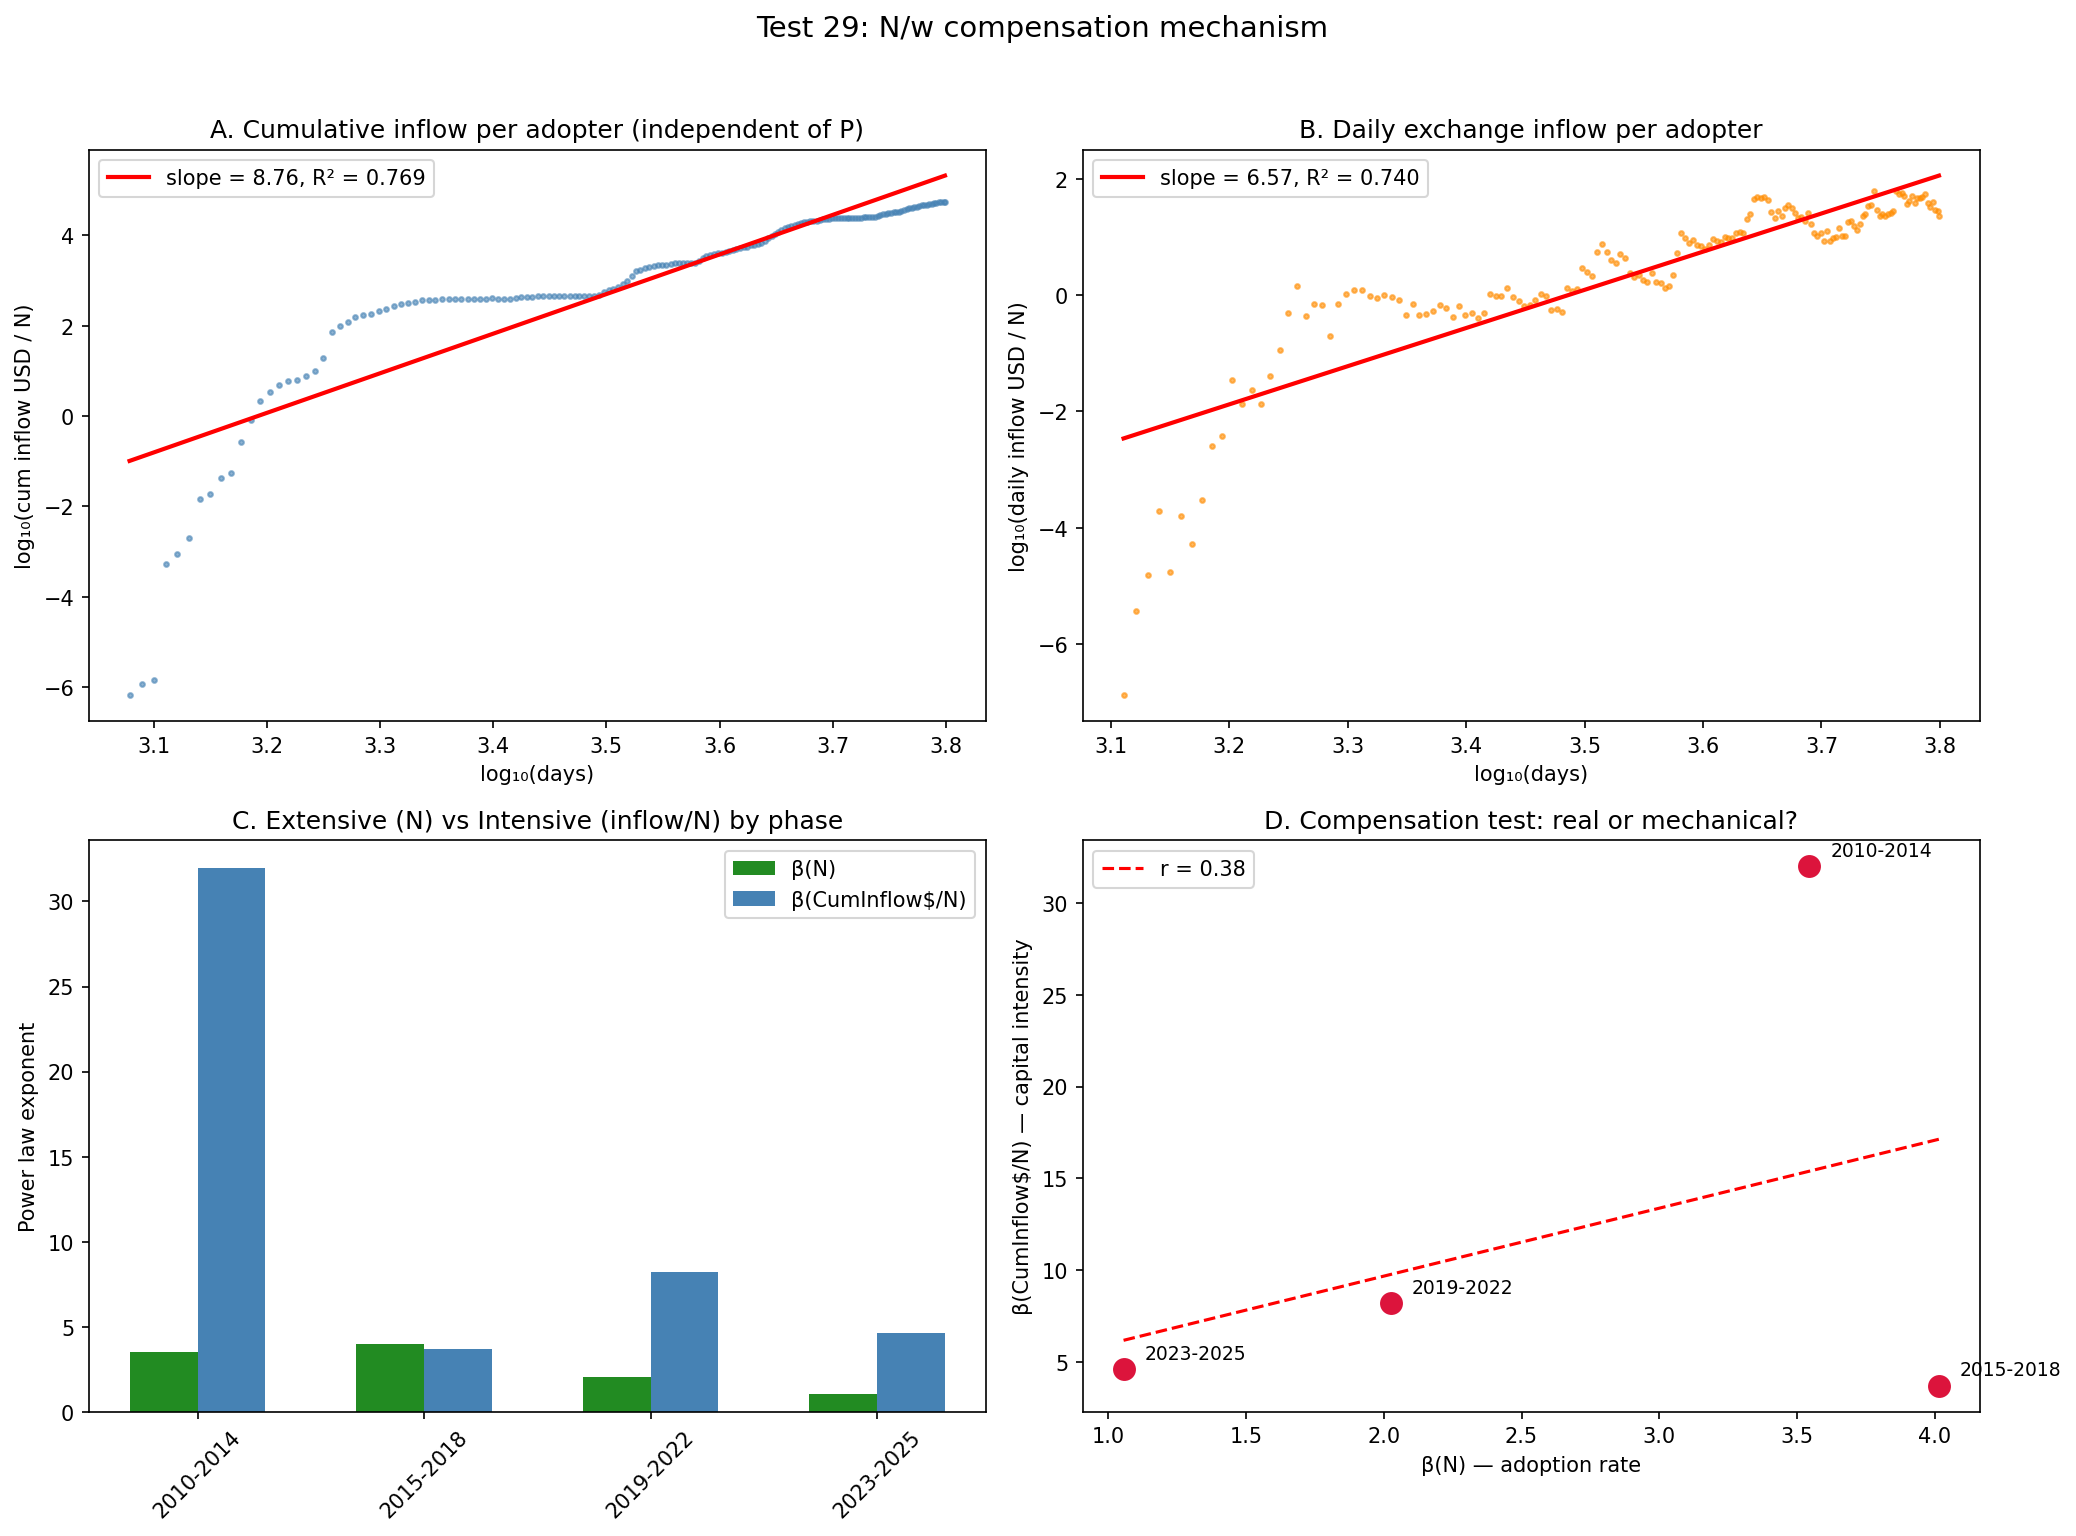
Compensation (flows) figure
Test 29 superseded
Compensation (flows)
Exchange flows cannot measure the compensation.
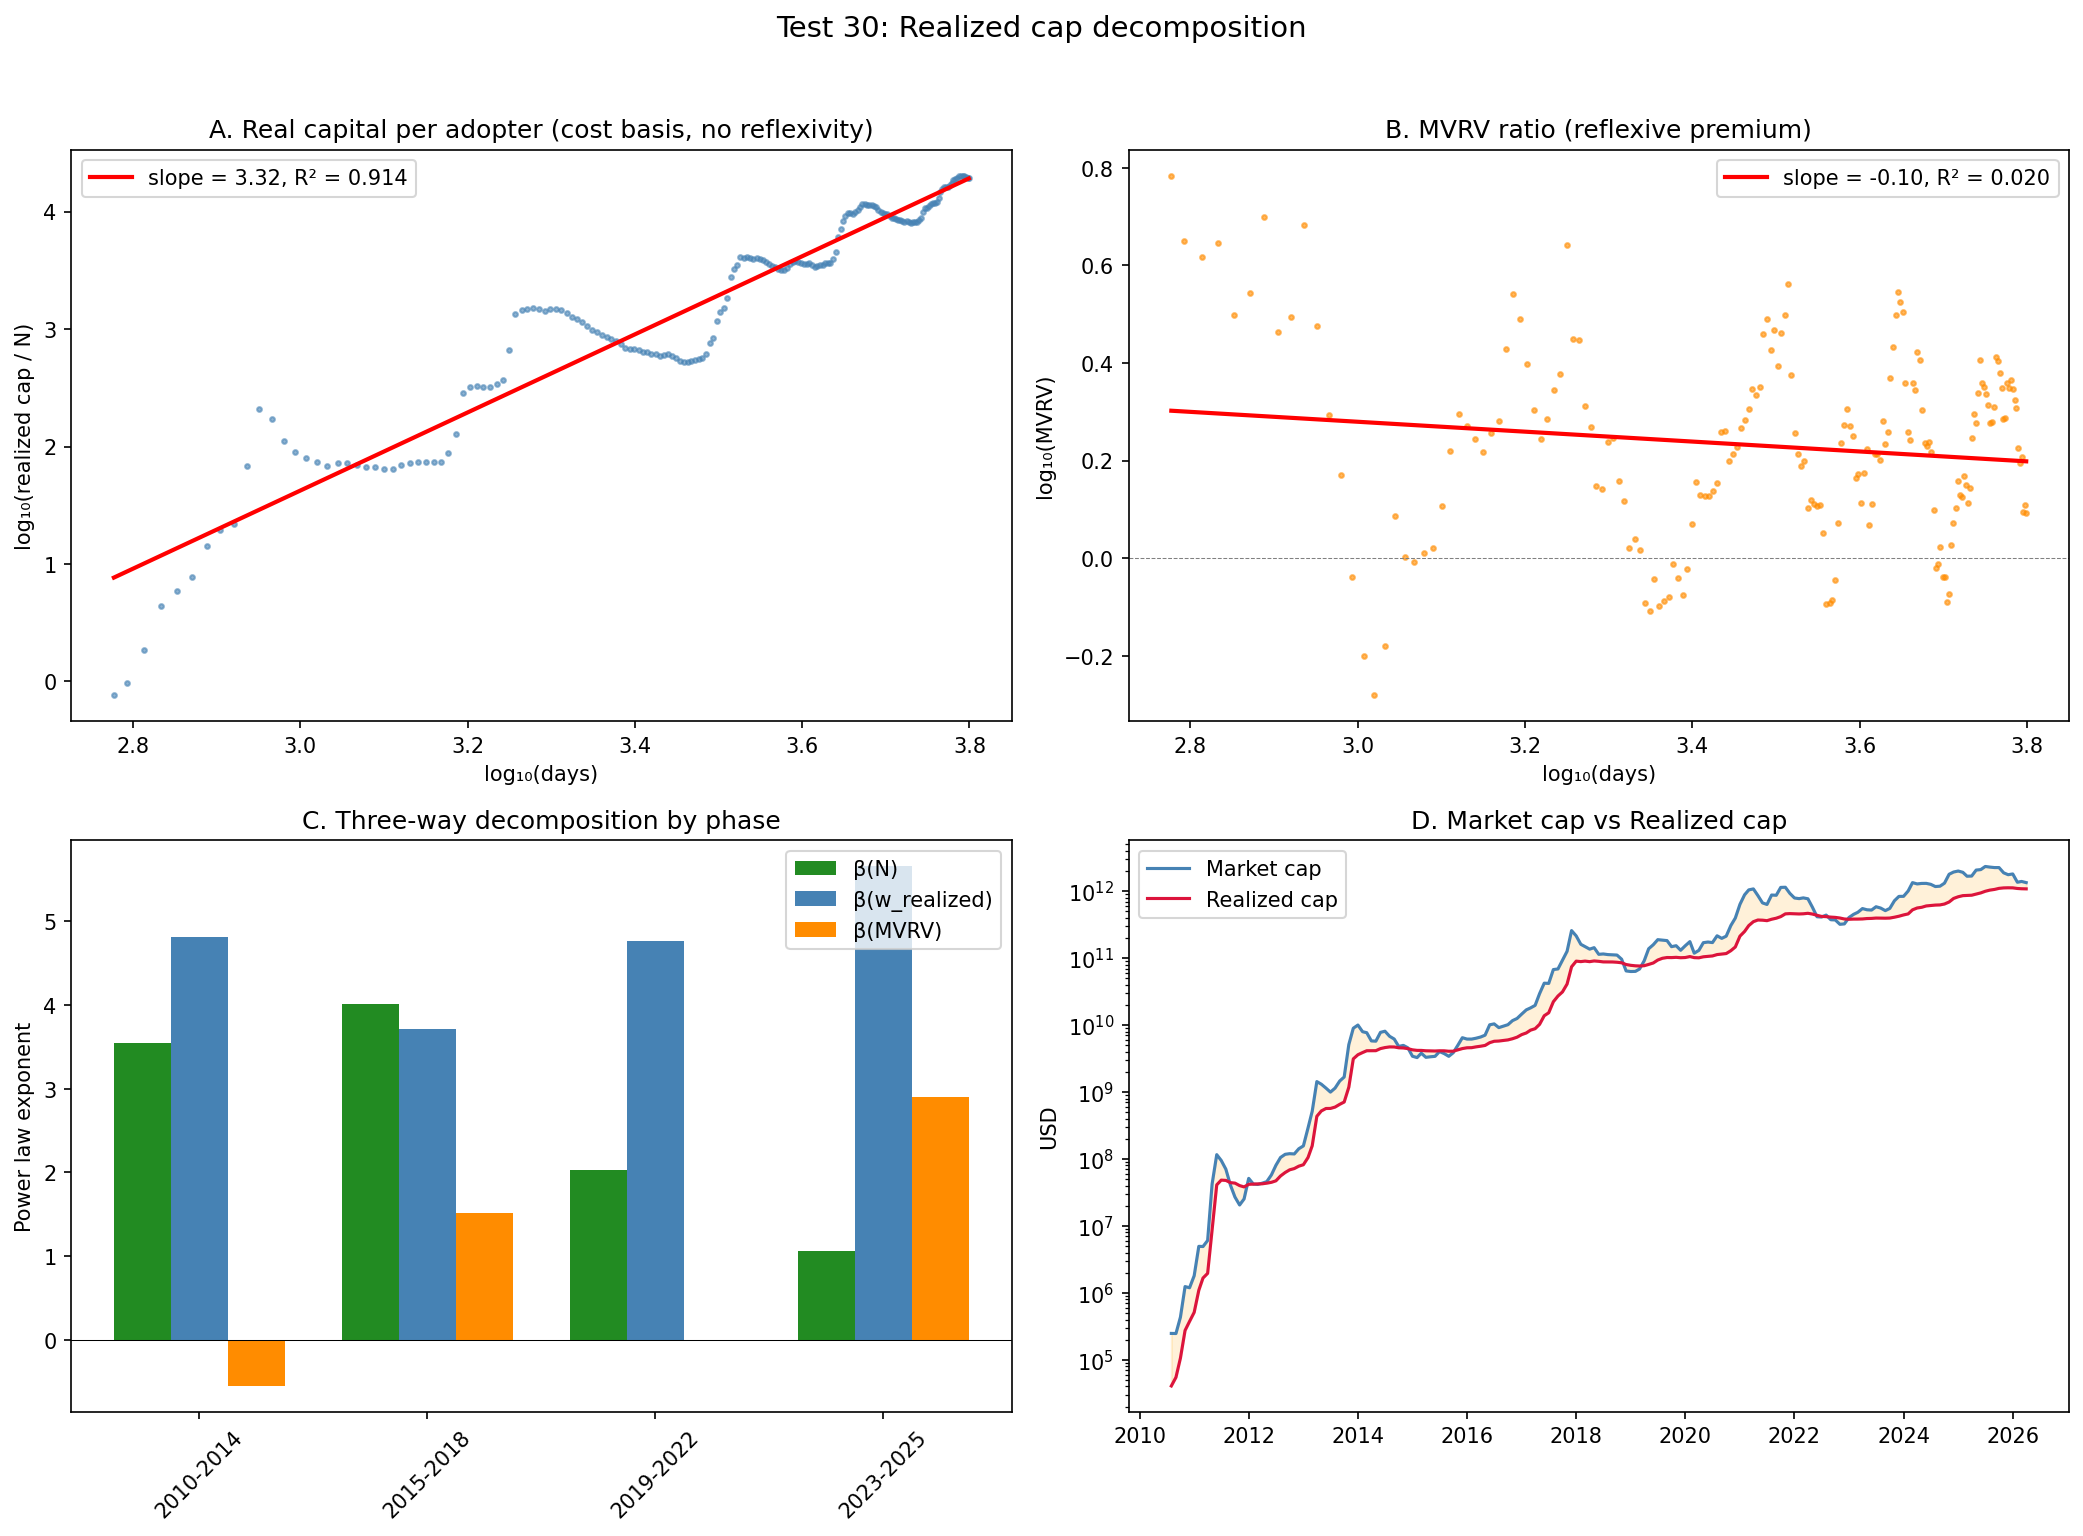
Realized cap figure
Test 30 corroborative
Realized cap
The N/w compensation is real in cost-basis terms (r = -0.864).
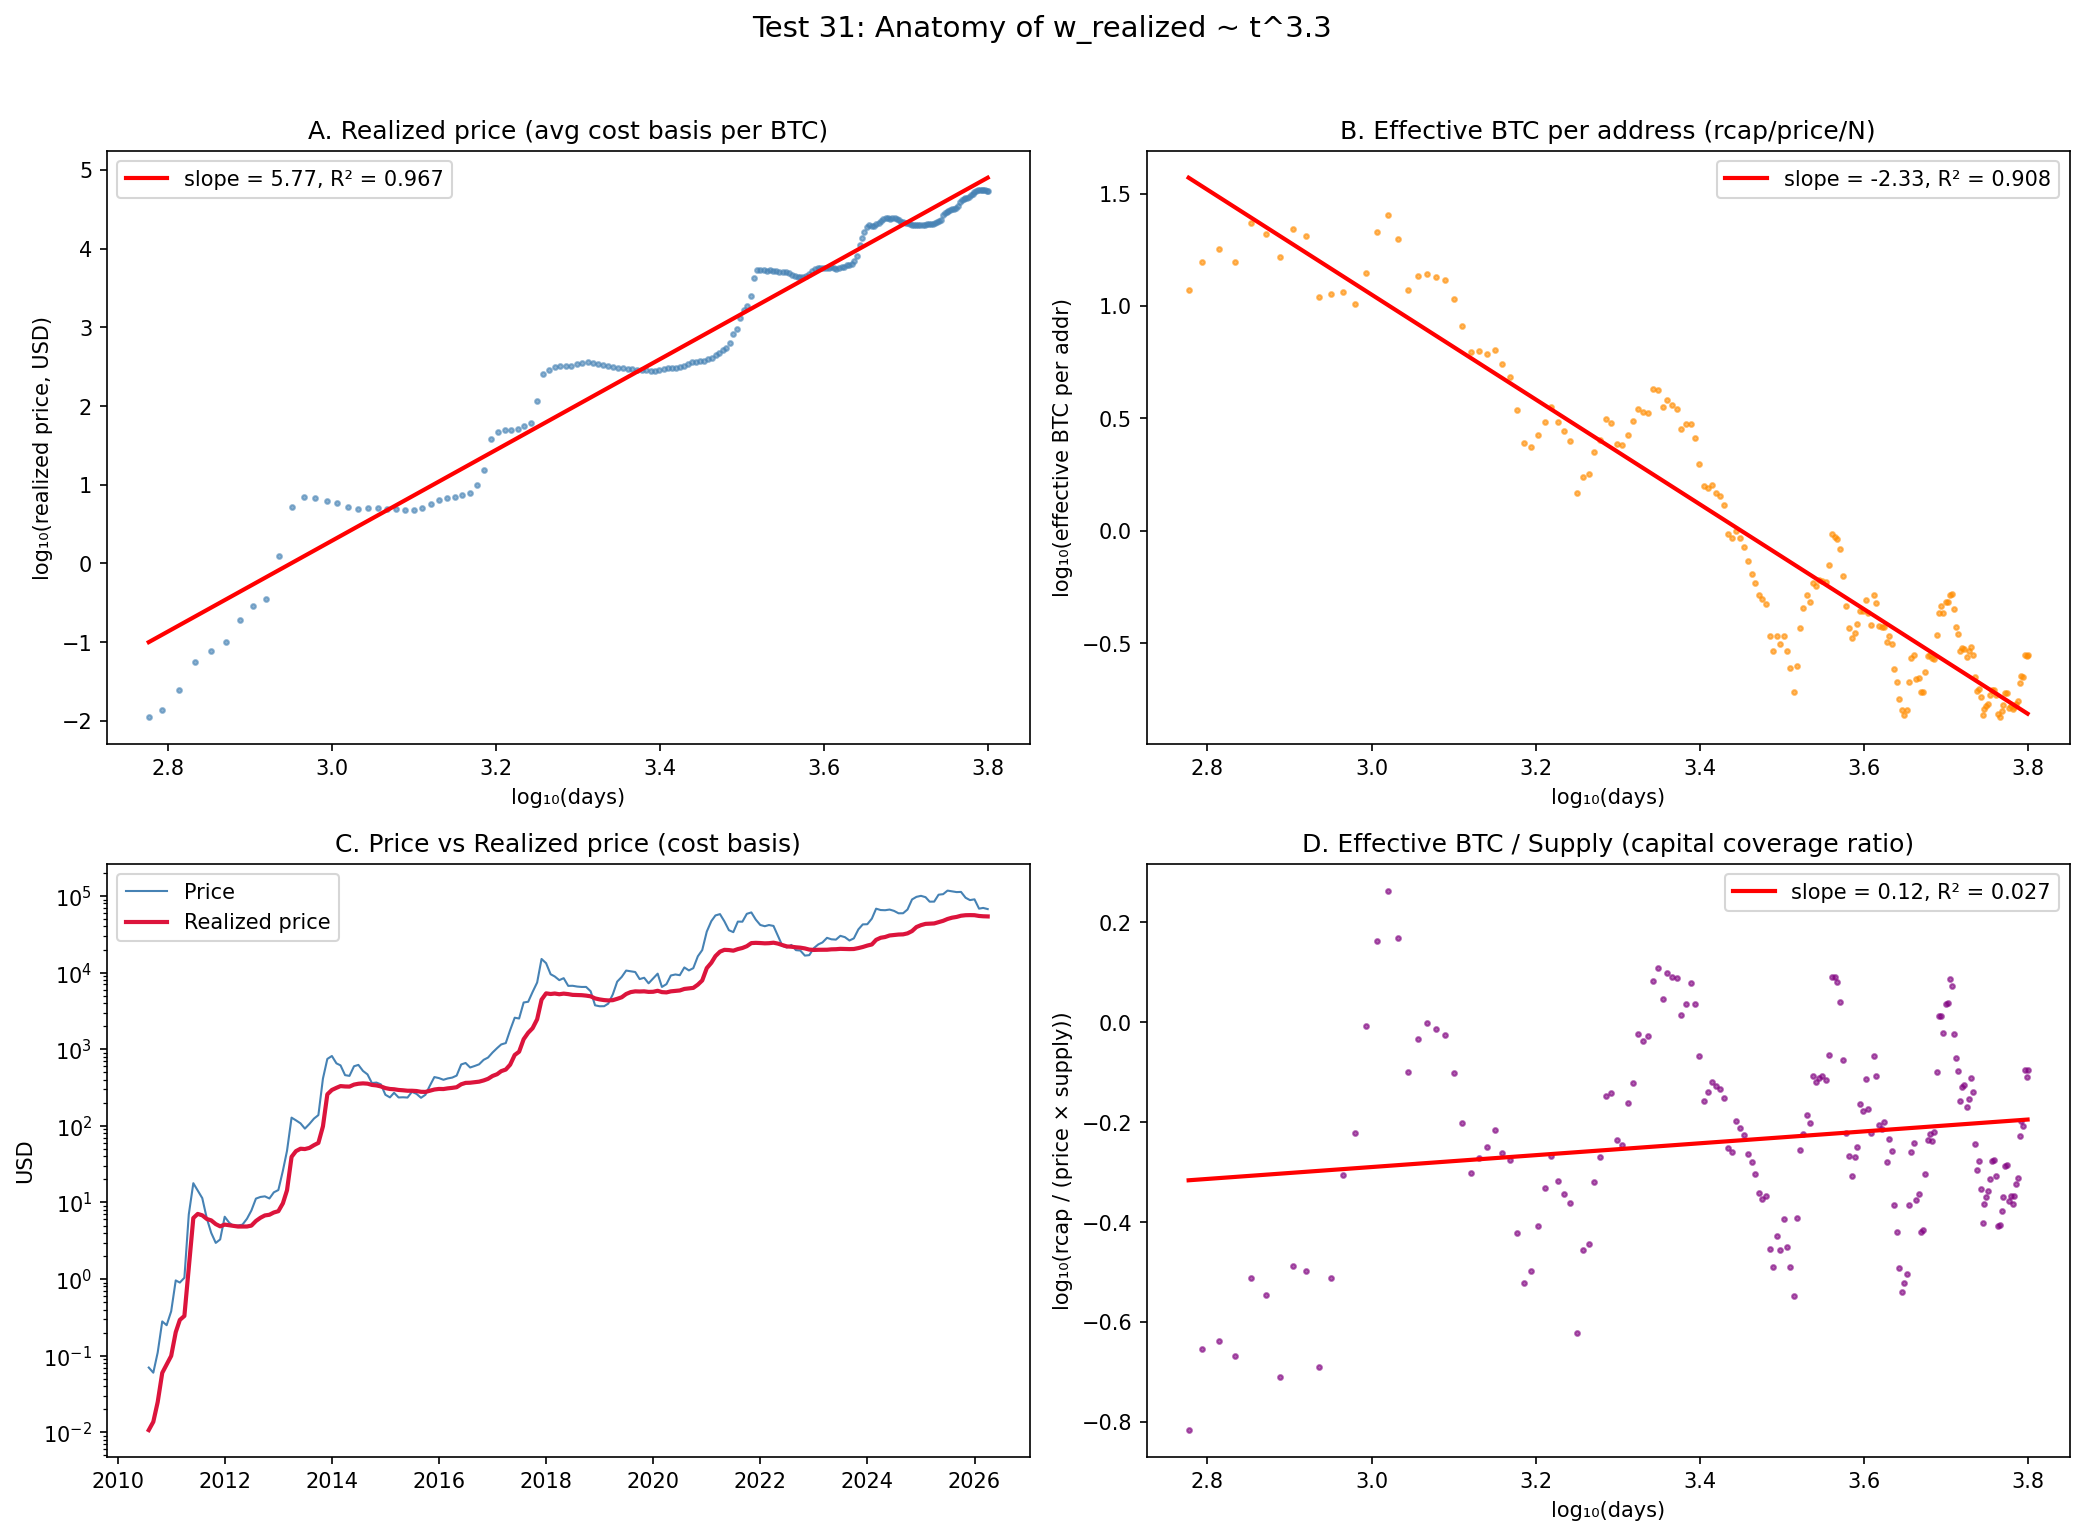
w_realized anatomy figure
Test 31 corroborative
w_realized anatomy
w_realized is smoothed price - Test 30 is an accounting identity.
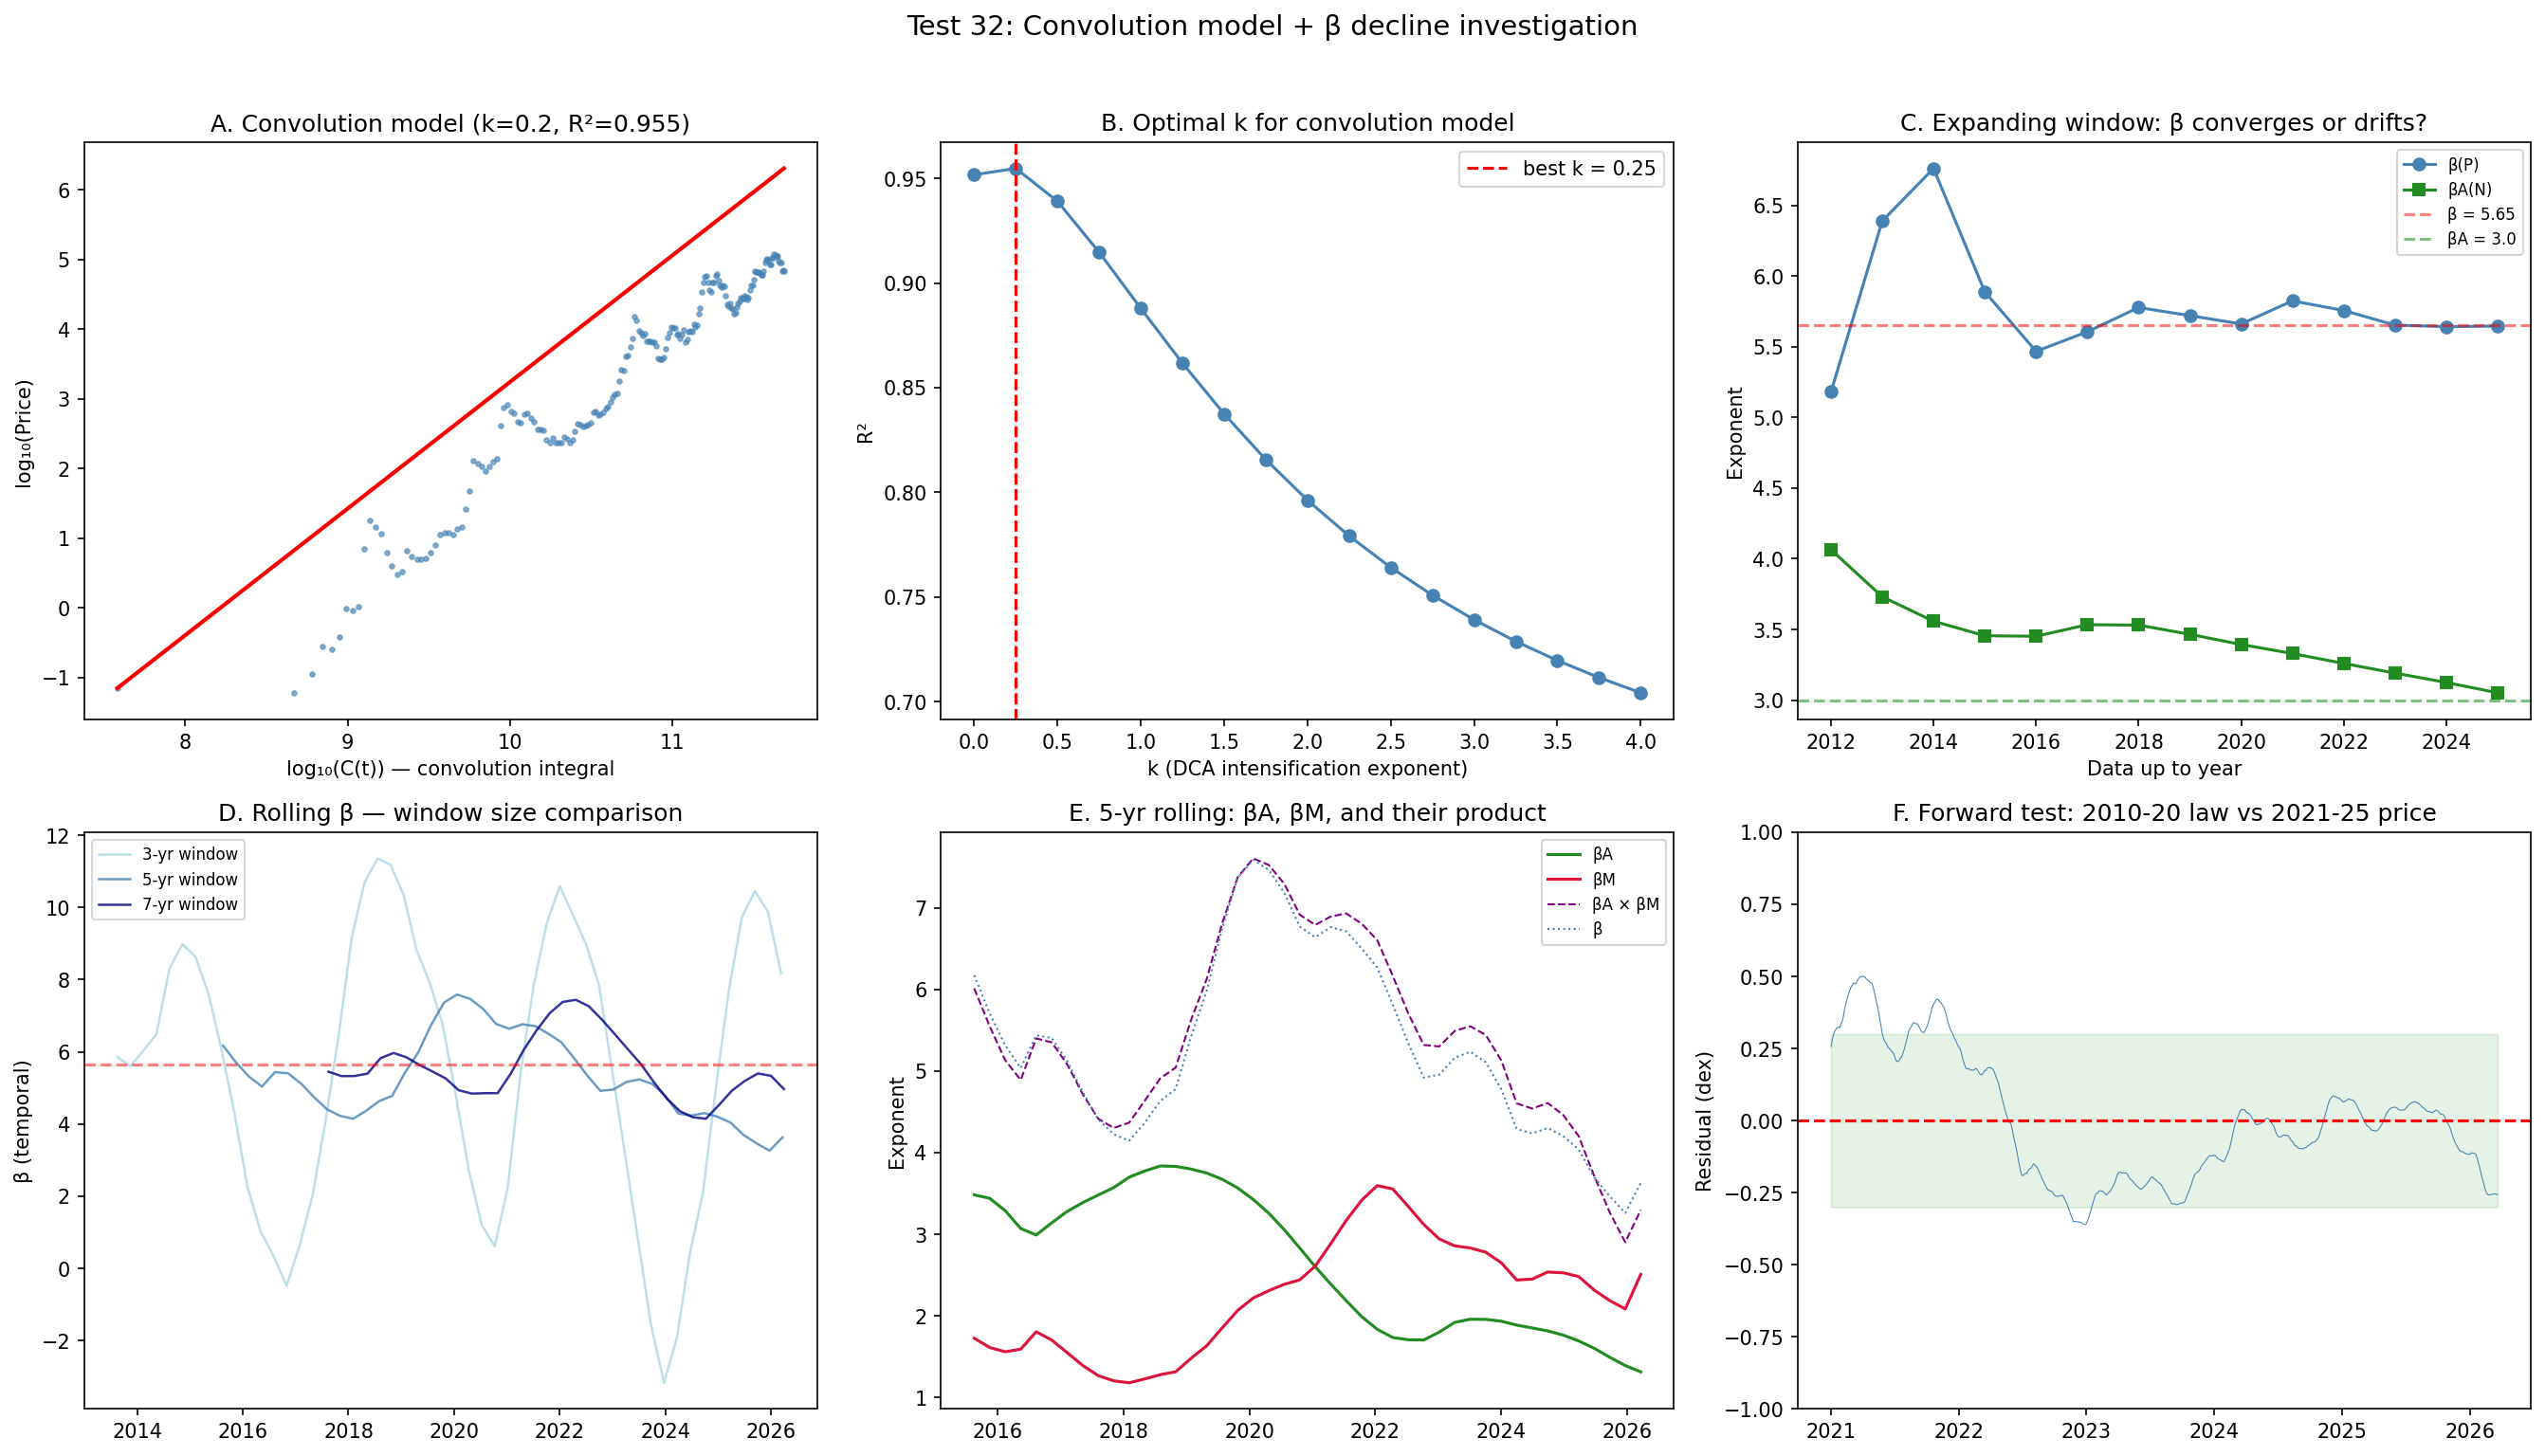
Convolution model figure
Test 32 ★ load-bearing
Convolution model
k ~ 0 with alpha = 1.82; the 2010-20 law predicts 2021-25 at -0.002 dex.
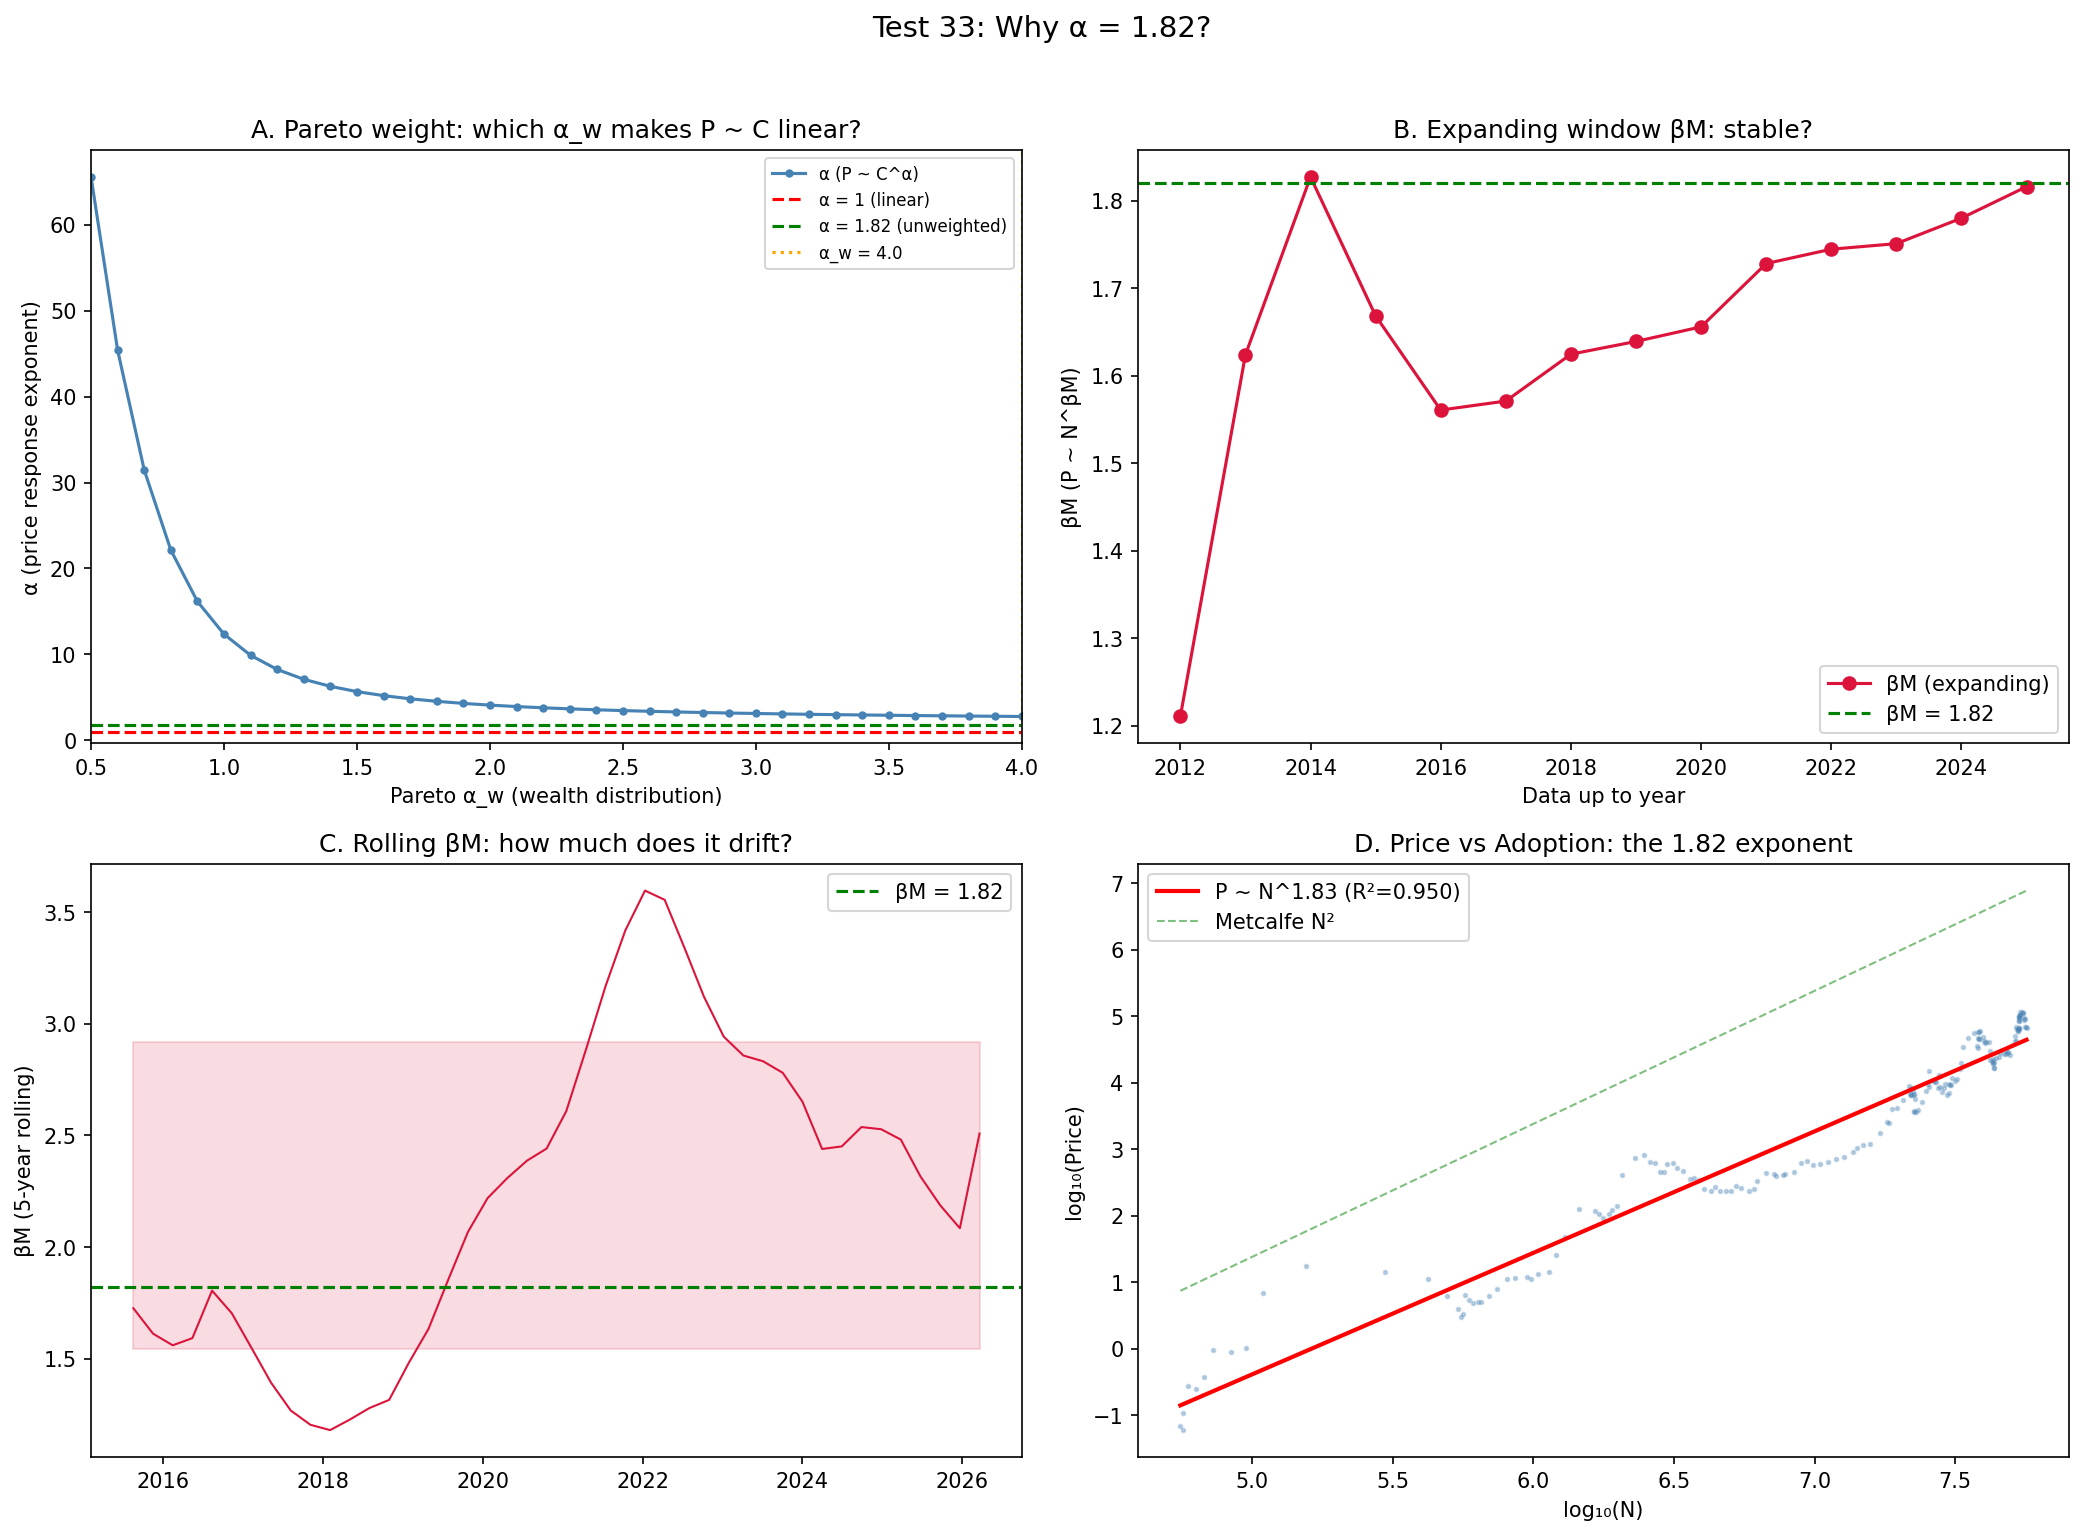
Why 1.82? figure
Test 33 superseded
Why 1.82?
Richest-first Pareto cannot do it - resolved by inverse ordering.
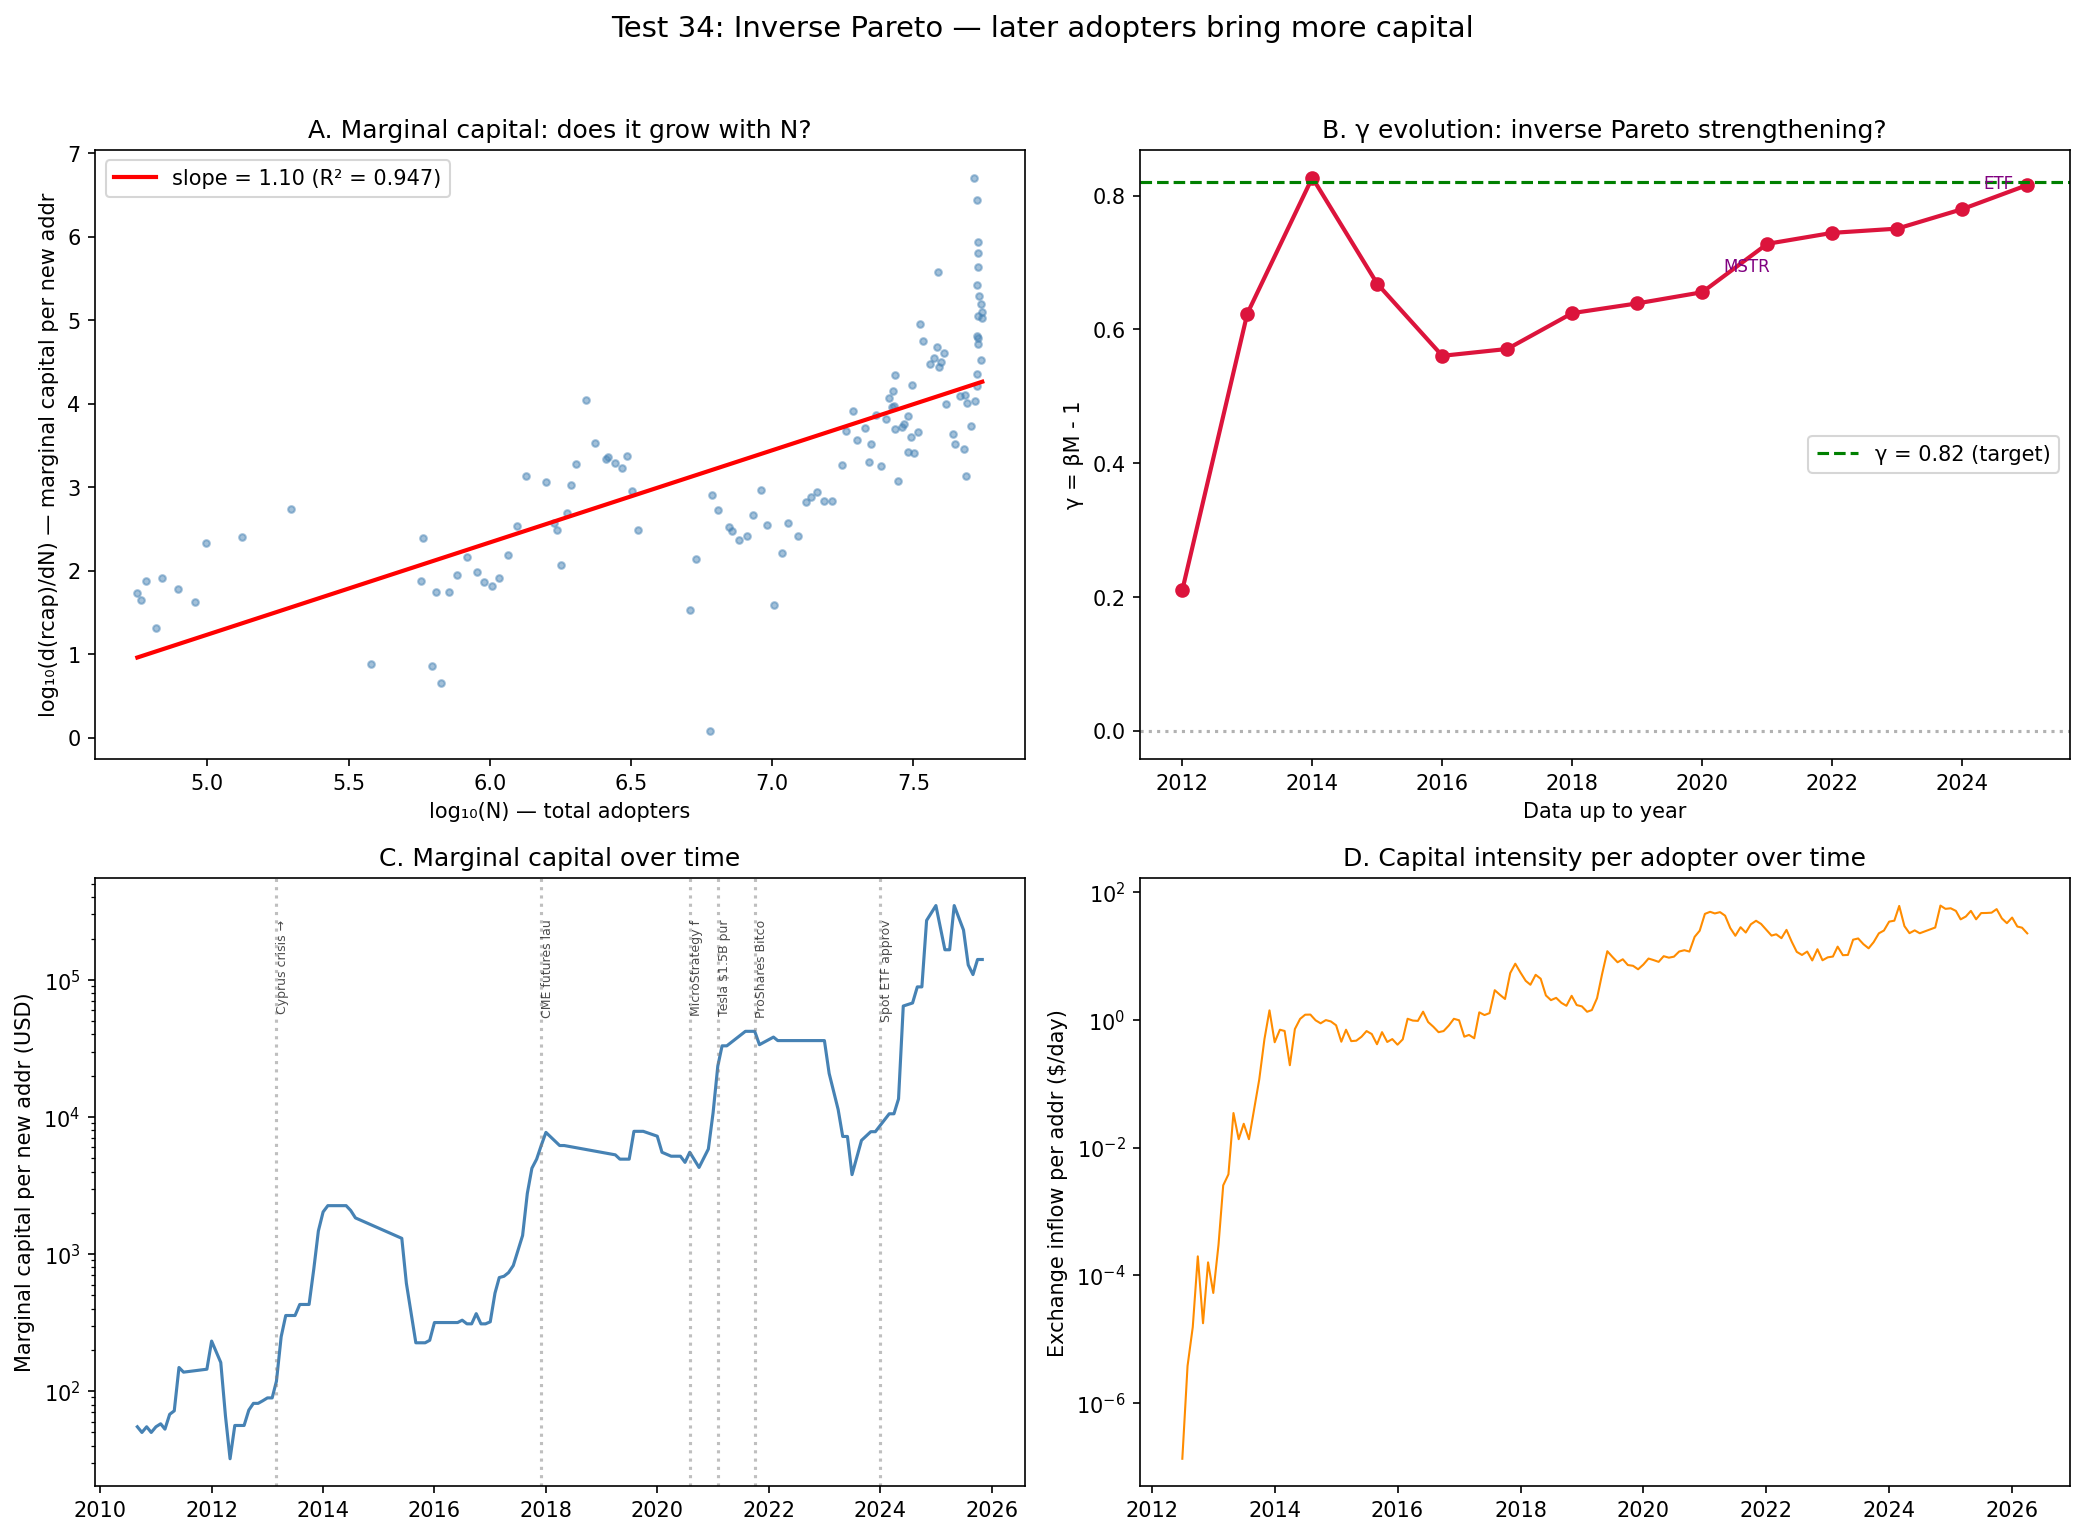
Inverse Pareto figure
Test 34 corroborative
Inverse Pareto
Later adopters bring MORE capital (marginal ~ N^1.10).
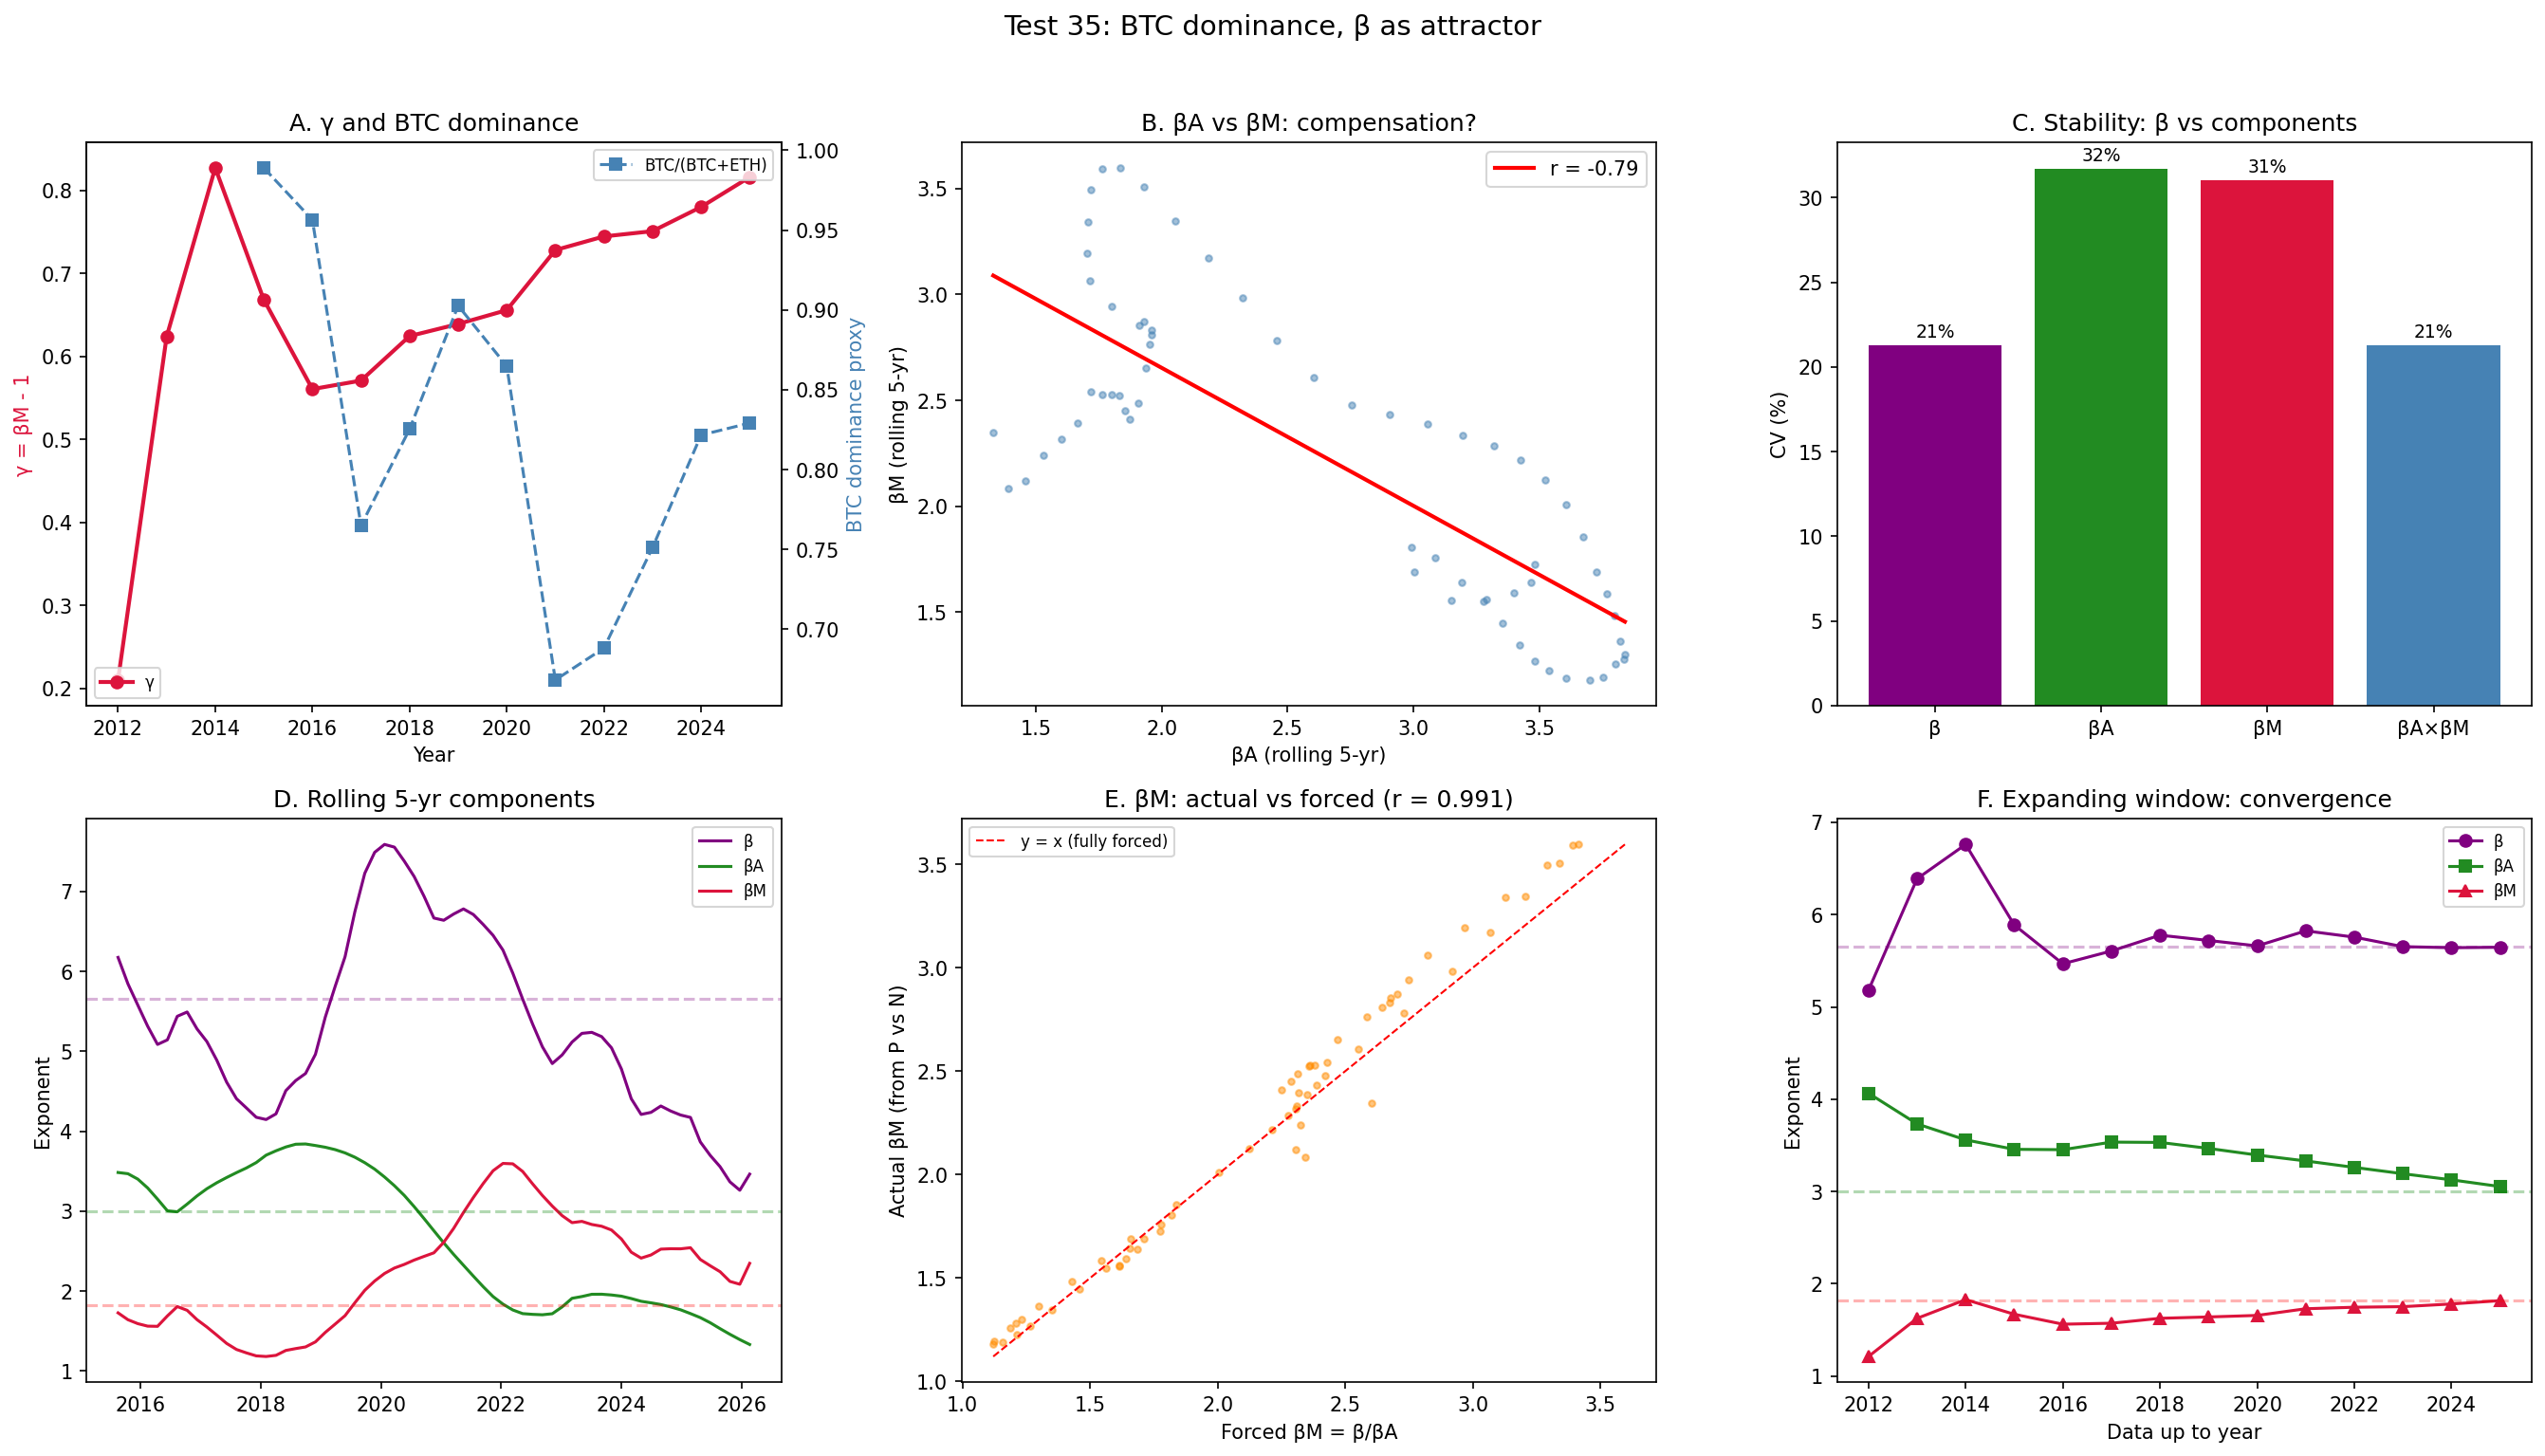
Beta as attractor figure
Test 35 ★ load-bearing
Beta as attractor
betaA and betaM compensate (r = -0.79); beta is the stable object.
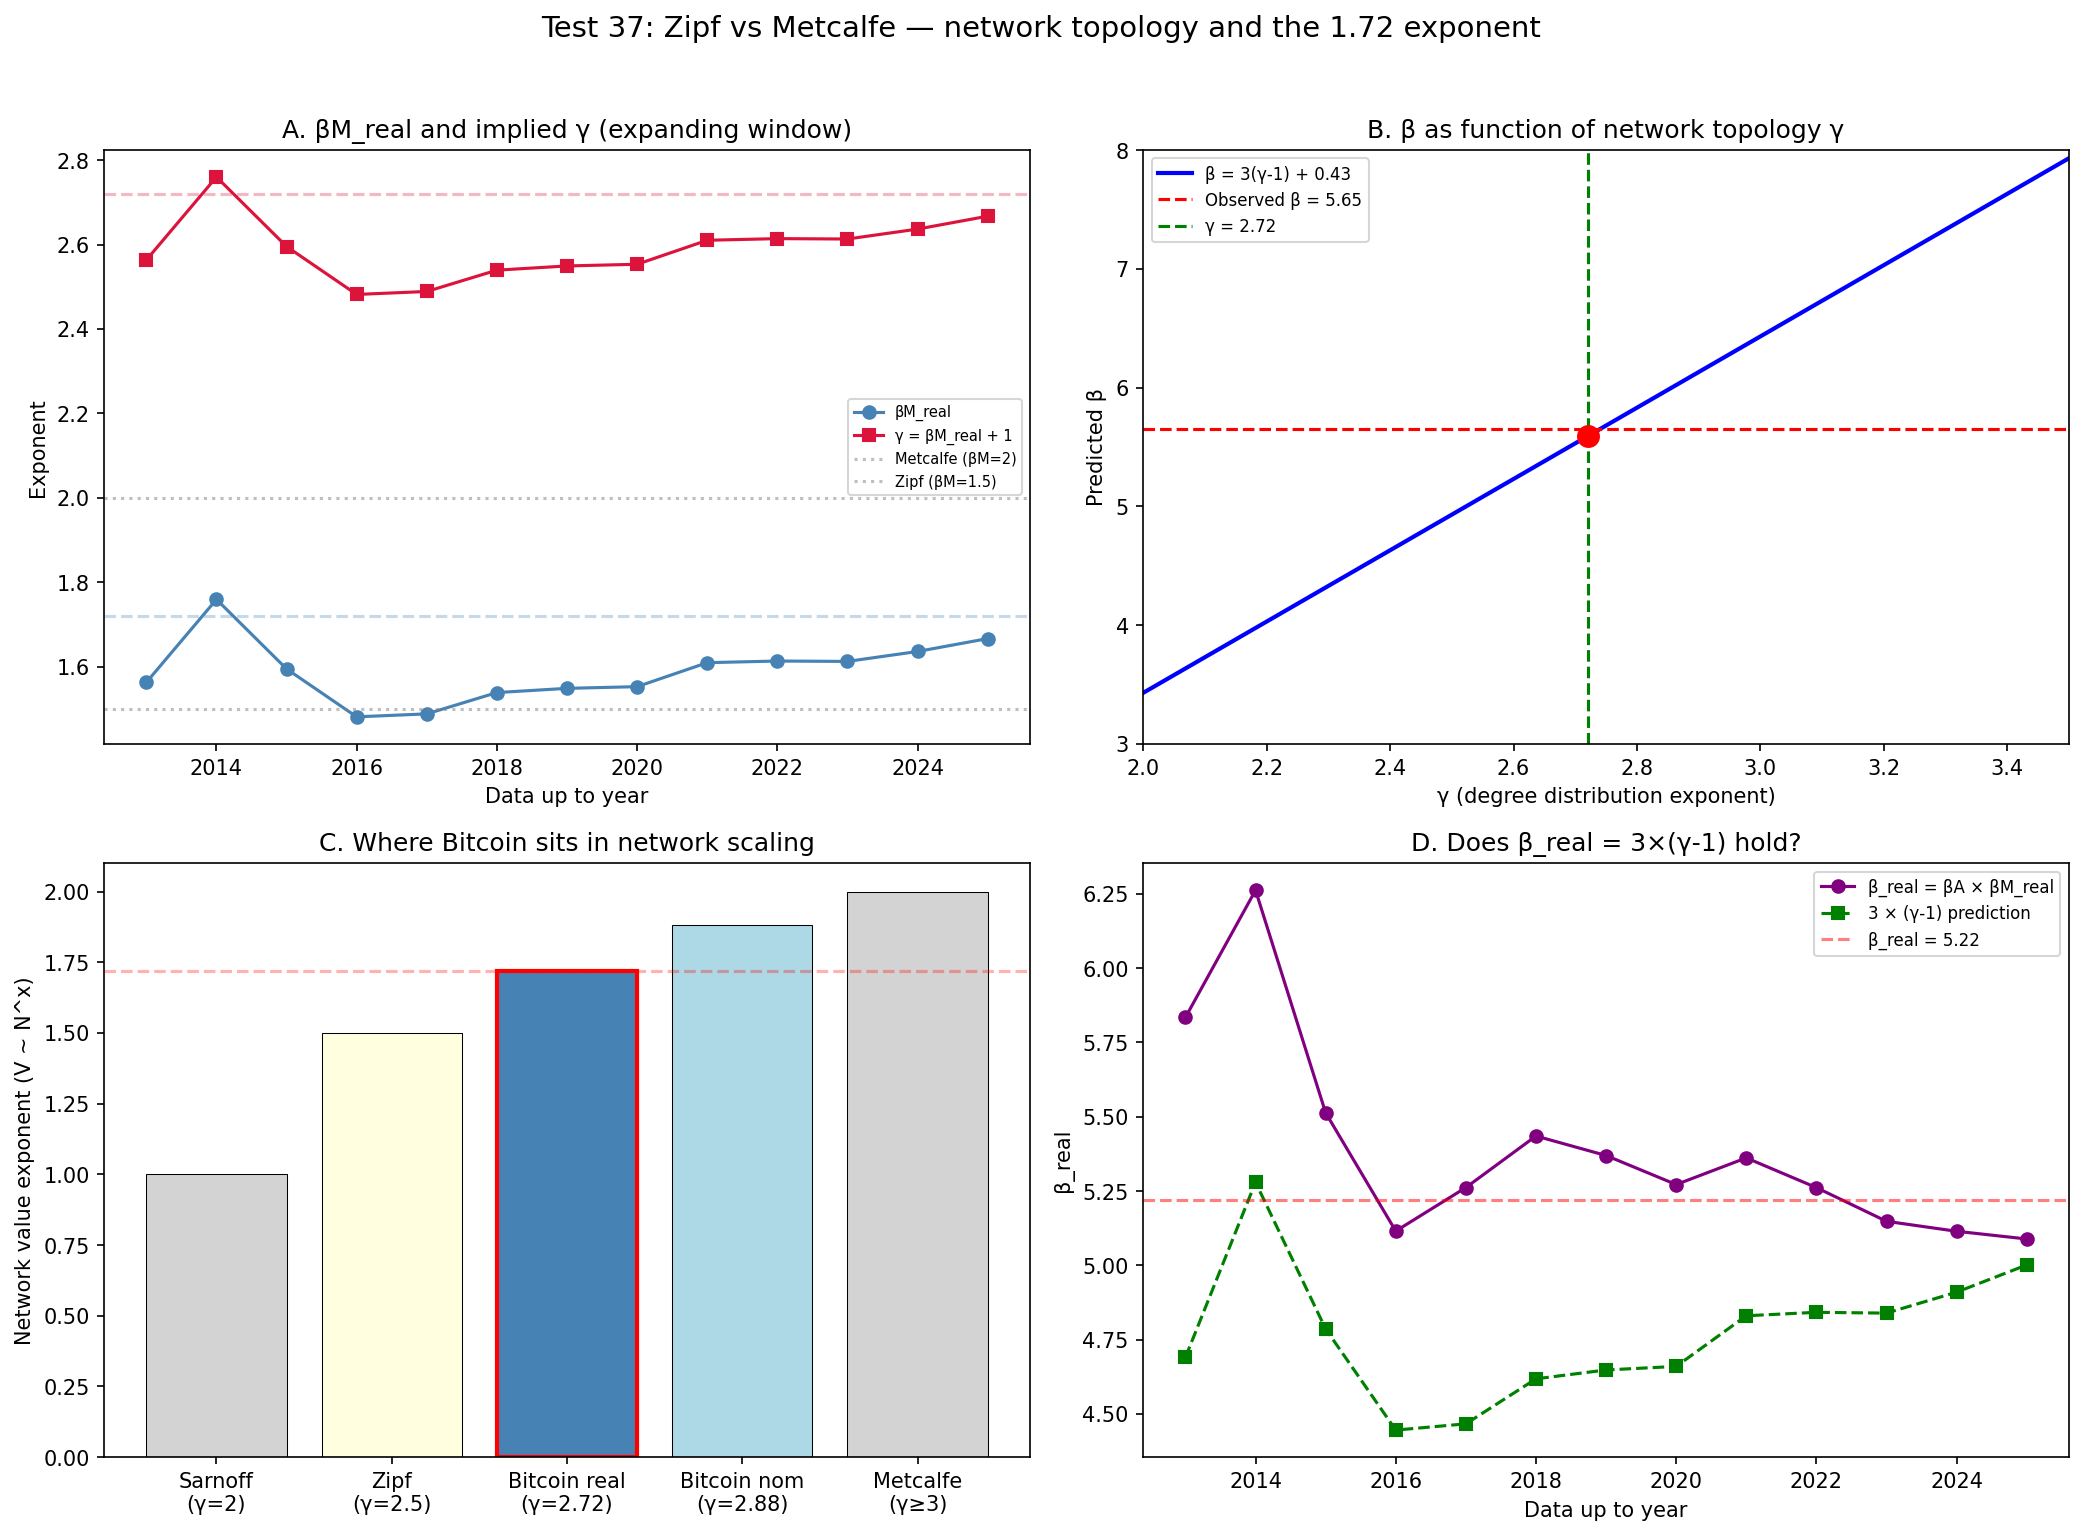
Zipf vs Metcalfe figure
Test 37 superseded
Zipf vs Metcalfe
Bitcoin sits between Zipf and Metcalfe scaling (gamma ~ 2.72).
Topology formula figure
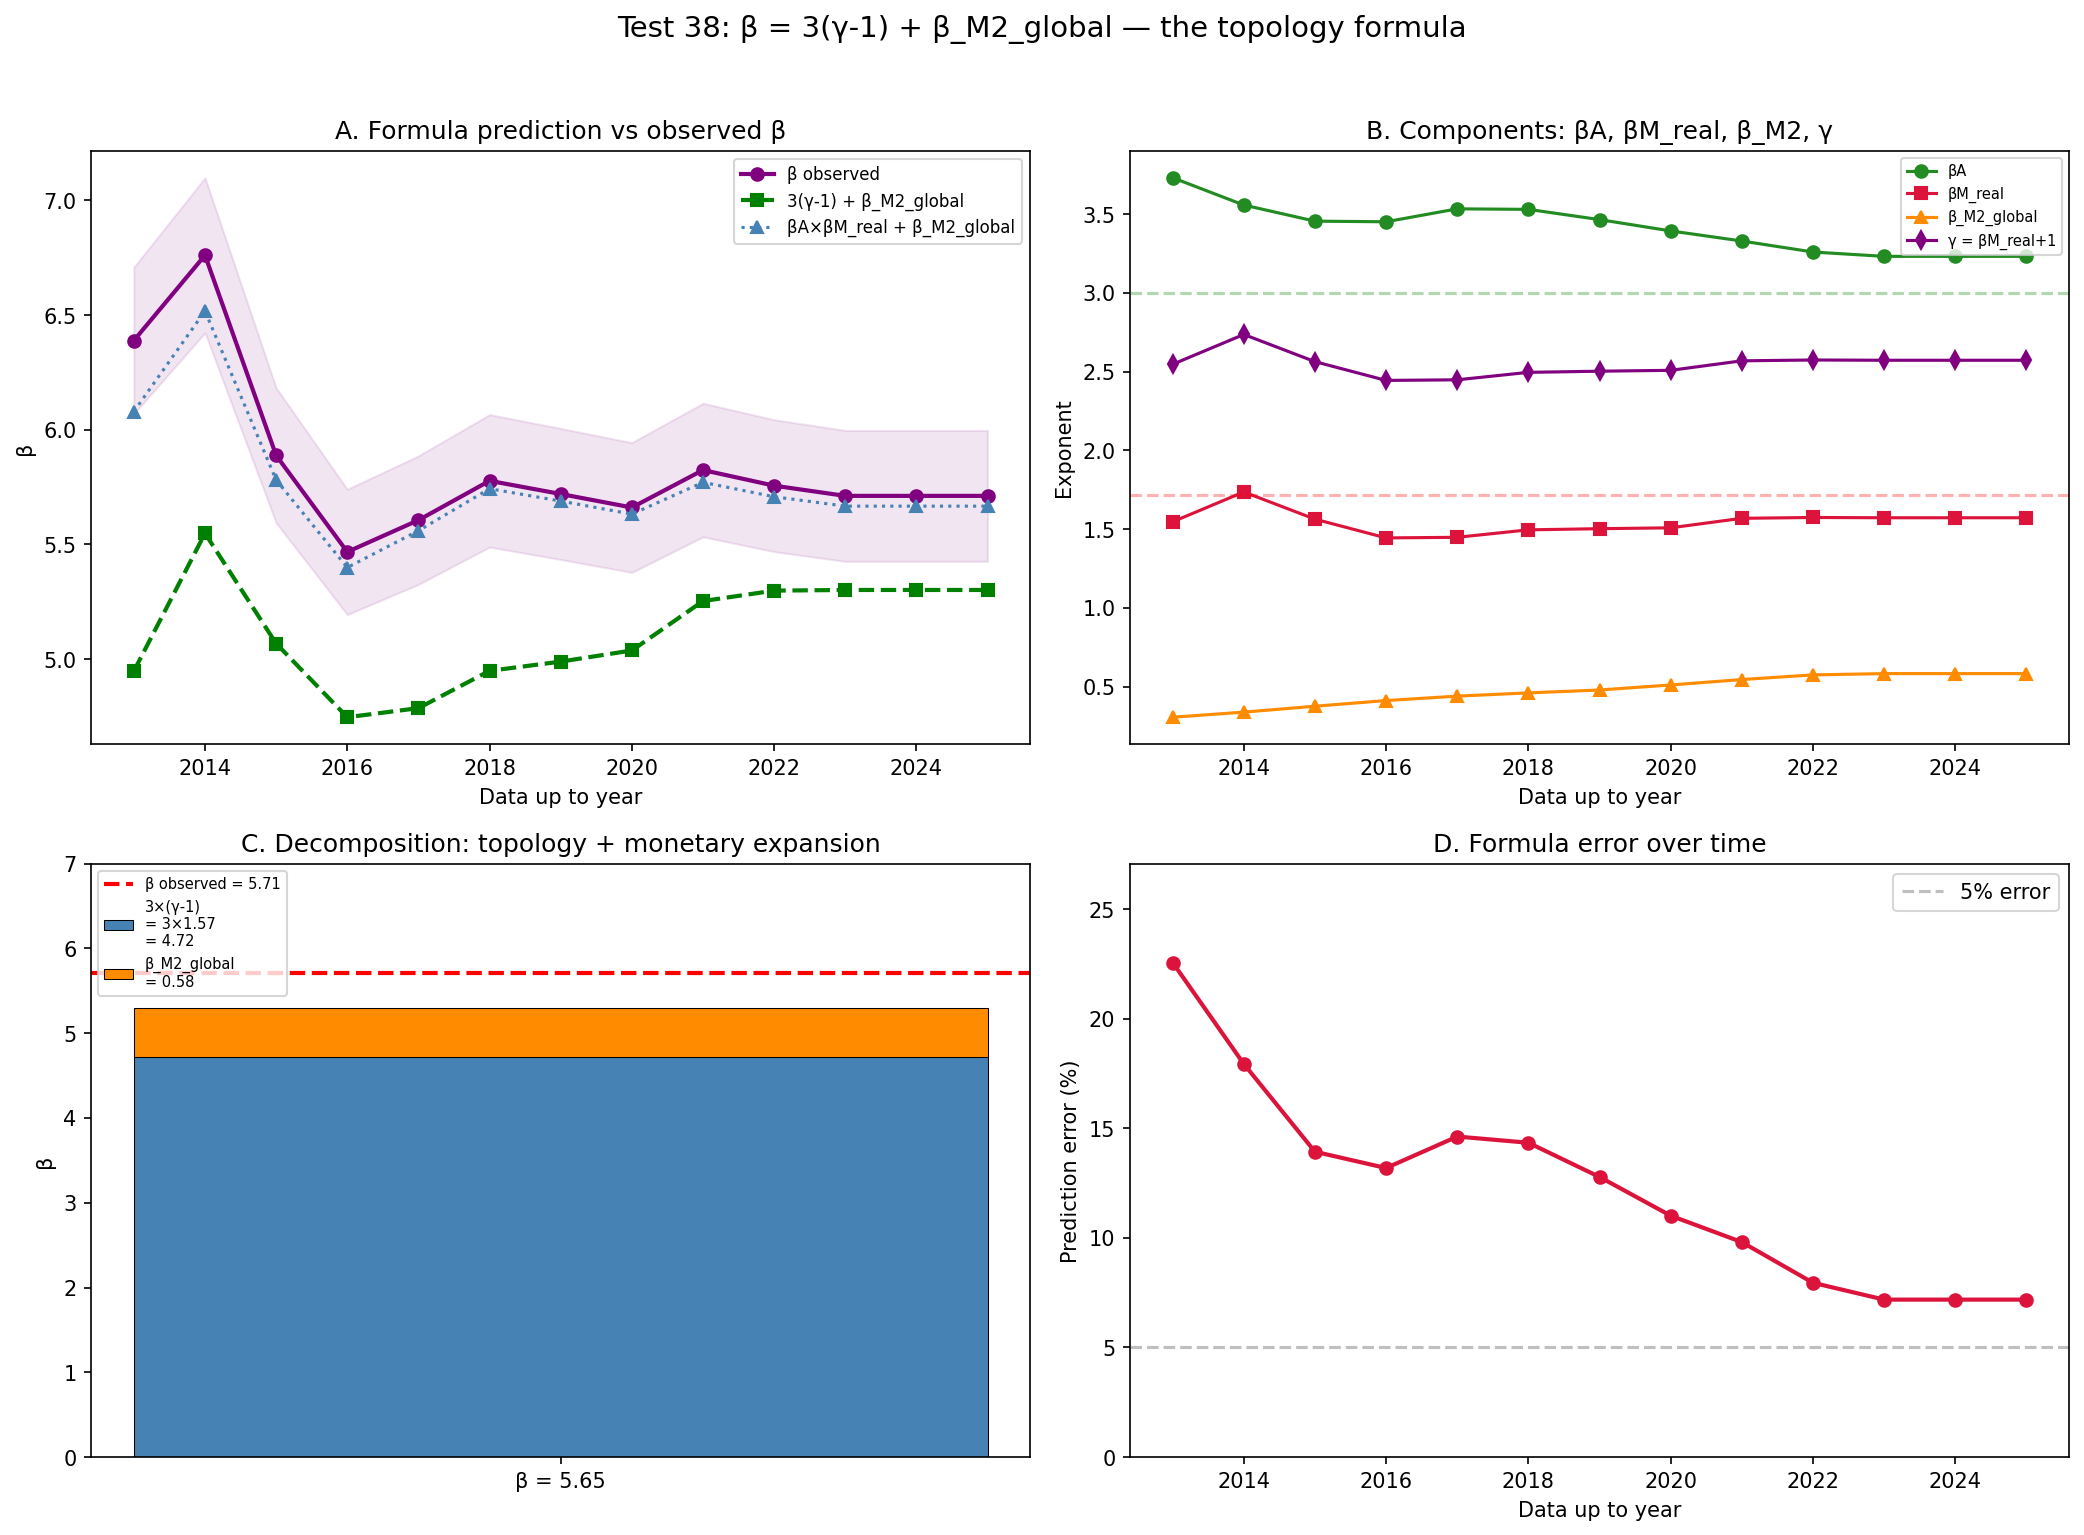
Test 38 superseded
Topology formula
Three independent measures recombine within 0.8%.
Residual analysis figure
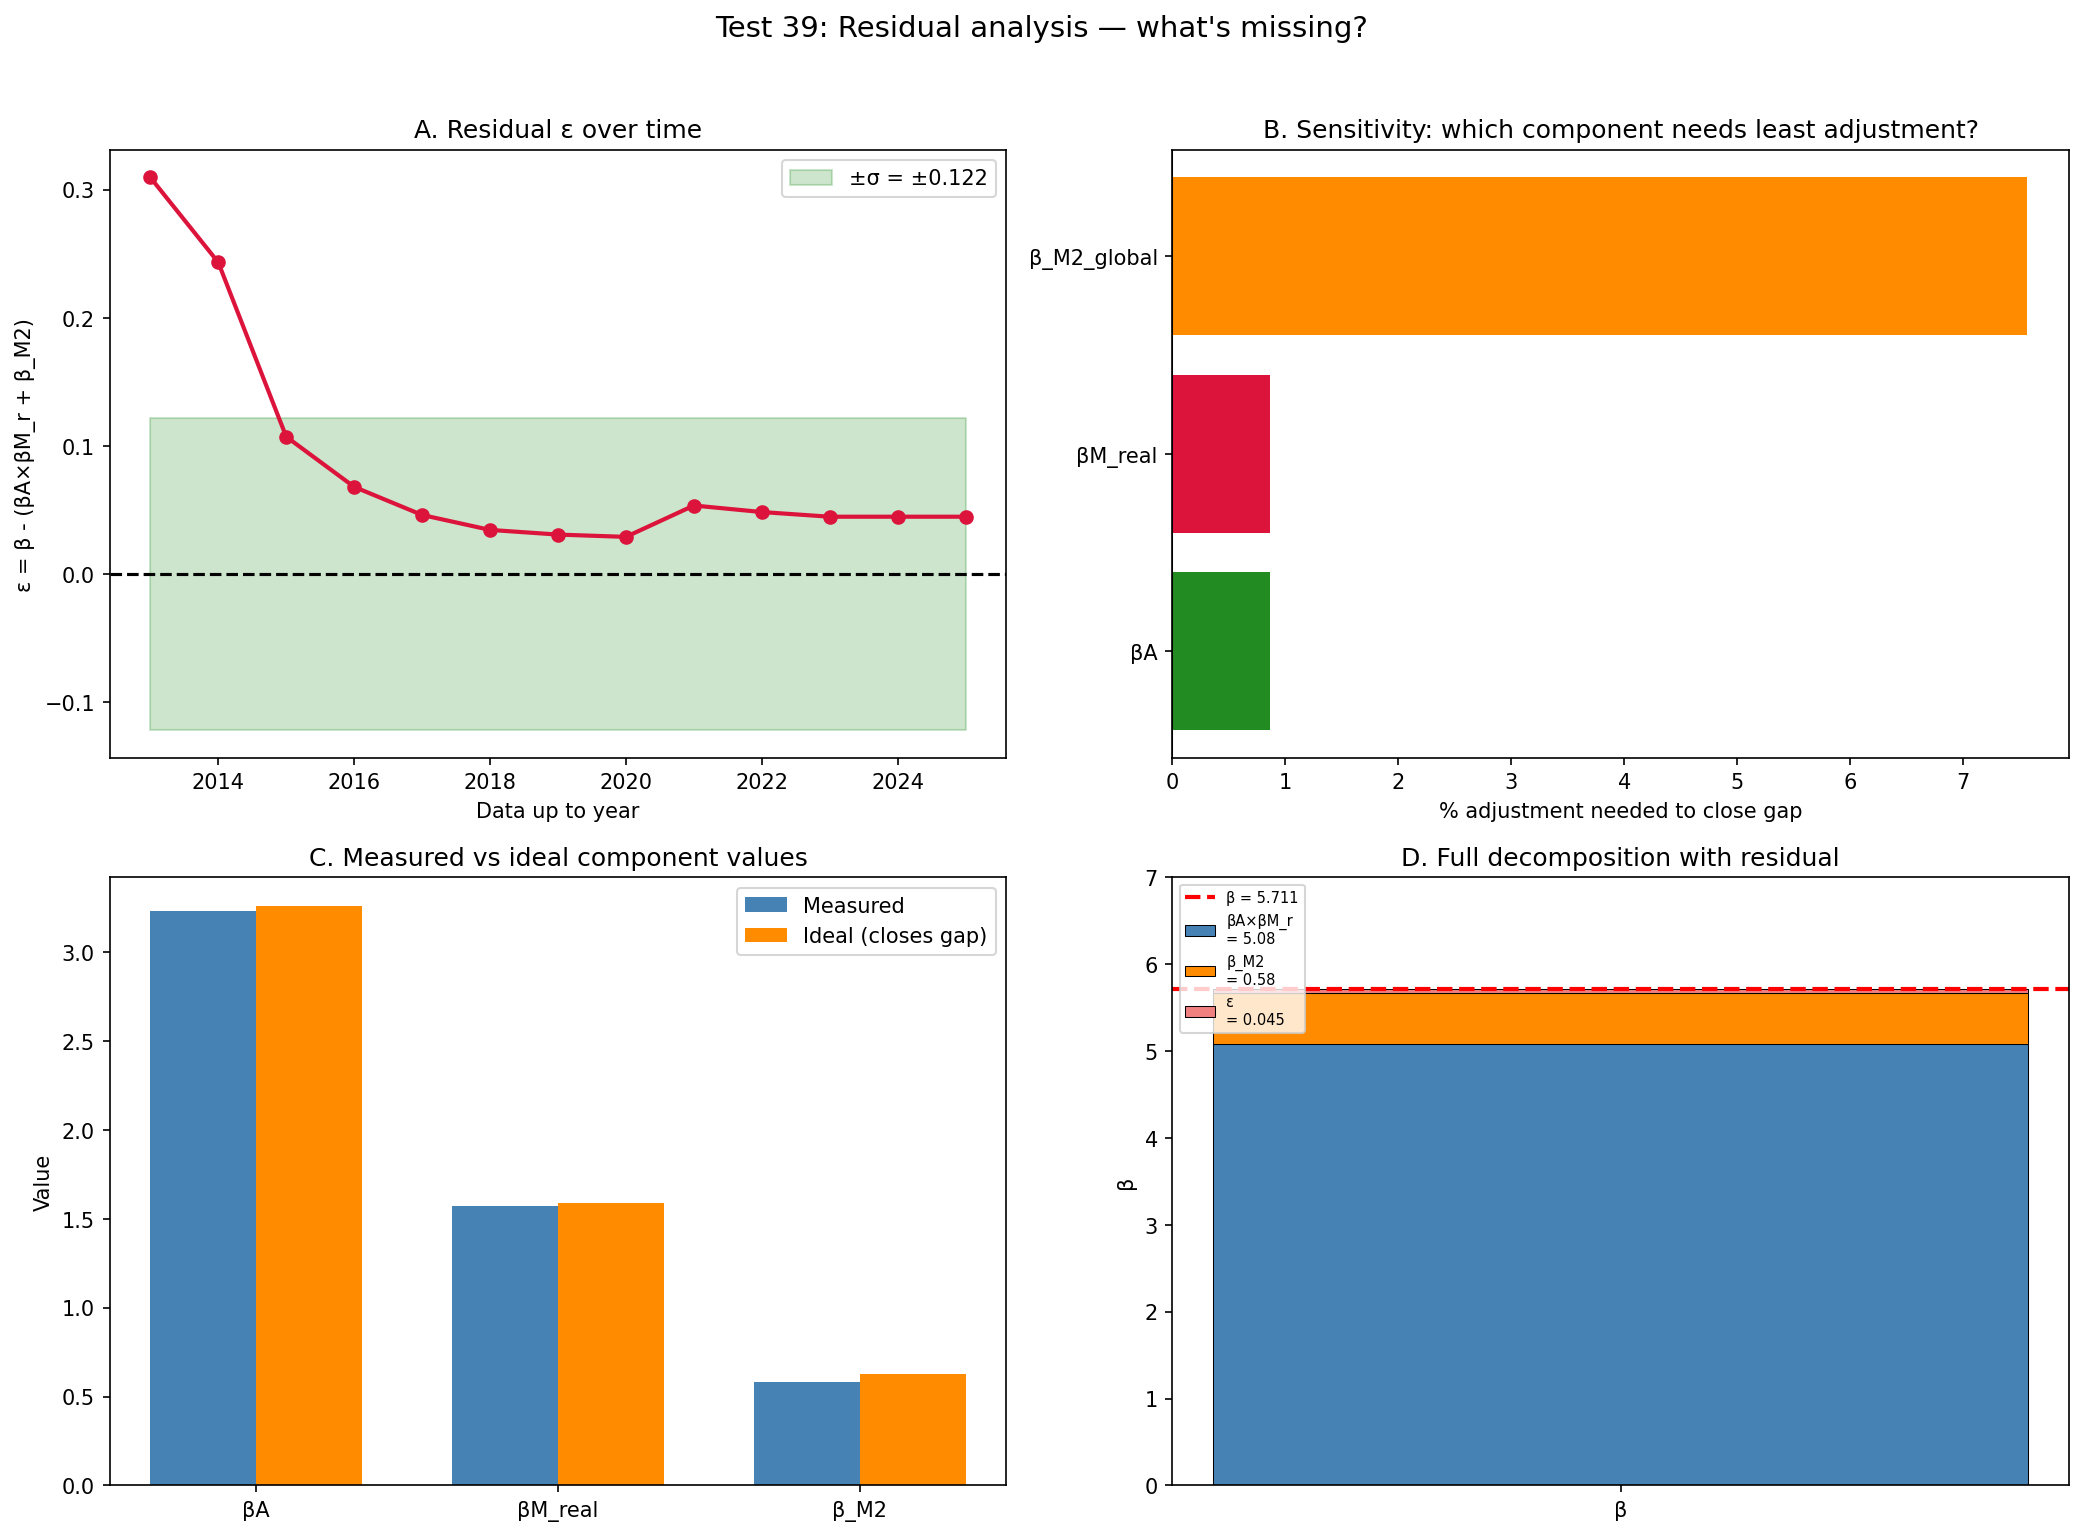
Test 39 superseded
Residual analysis
The 0.8% residual is statistically insignificant (0.36 sigma).
Gamma expanding figure
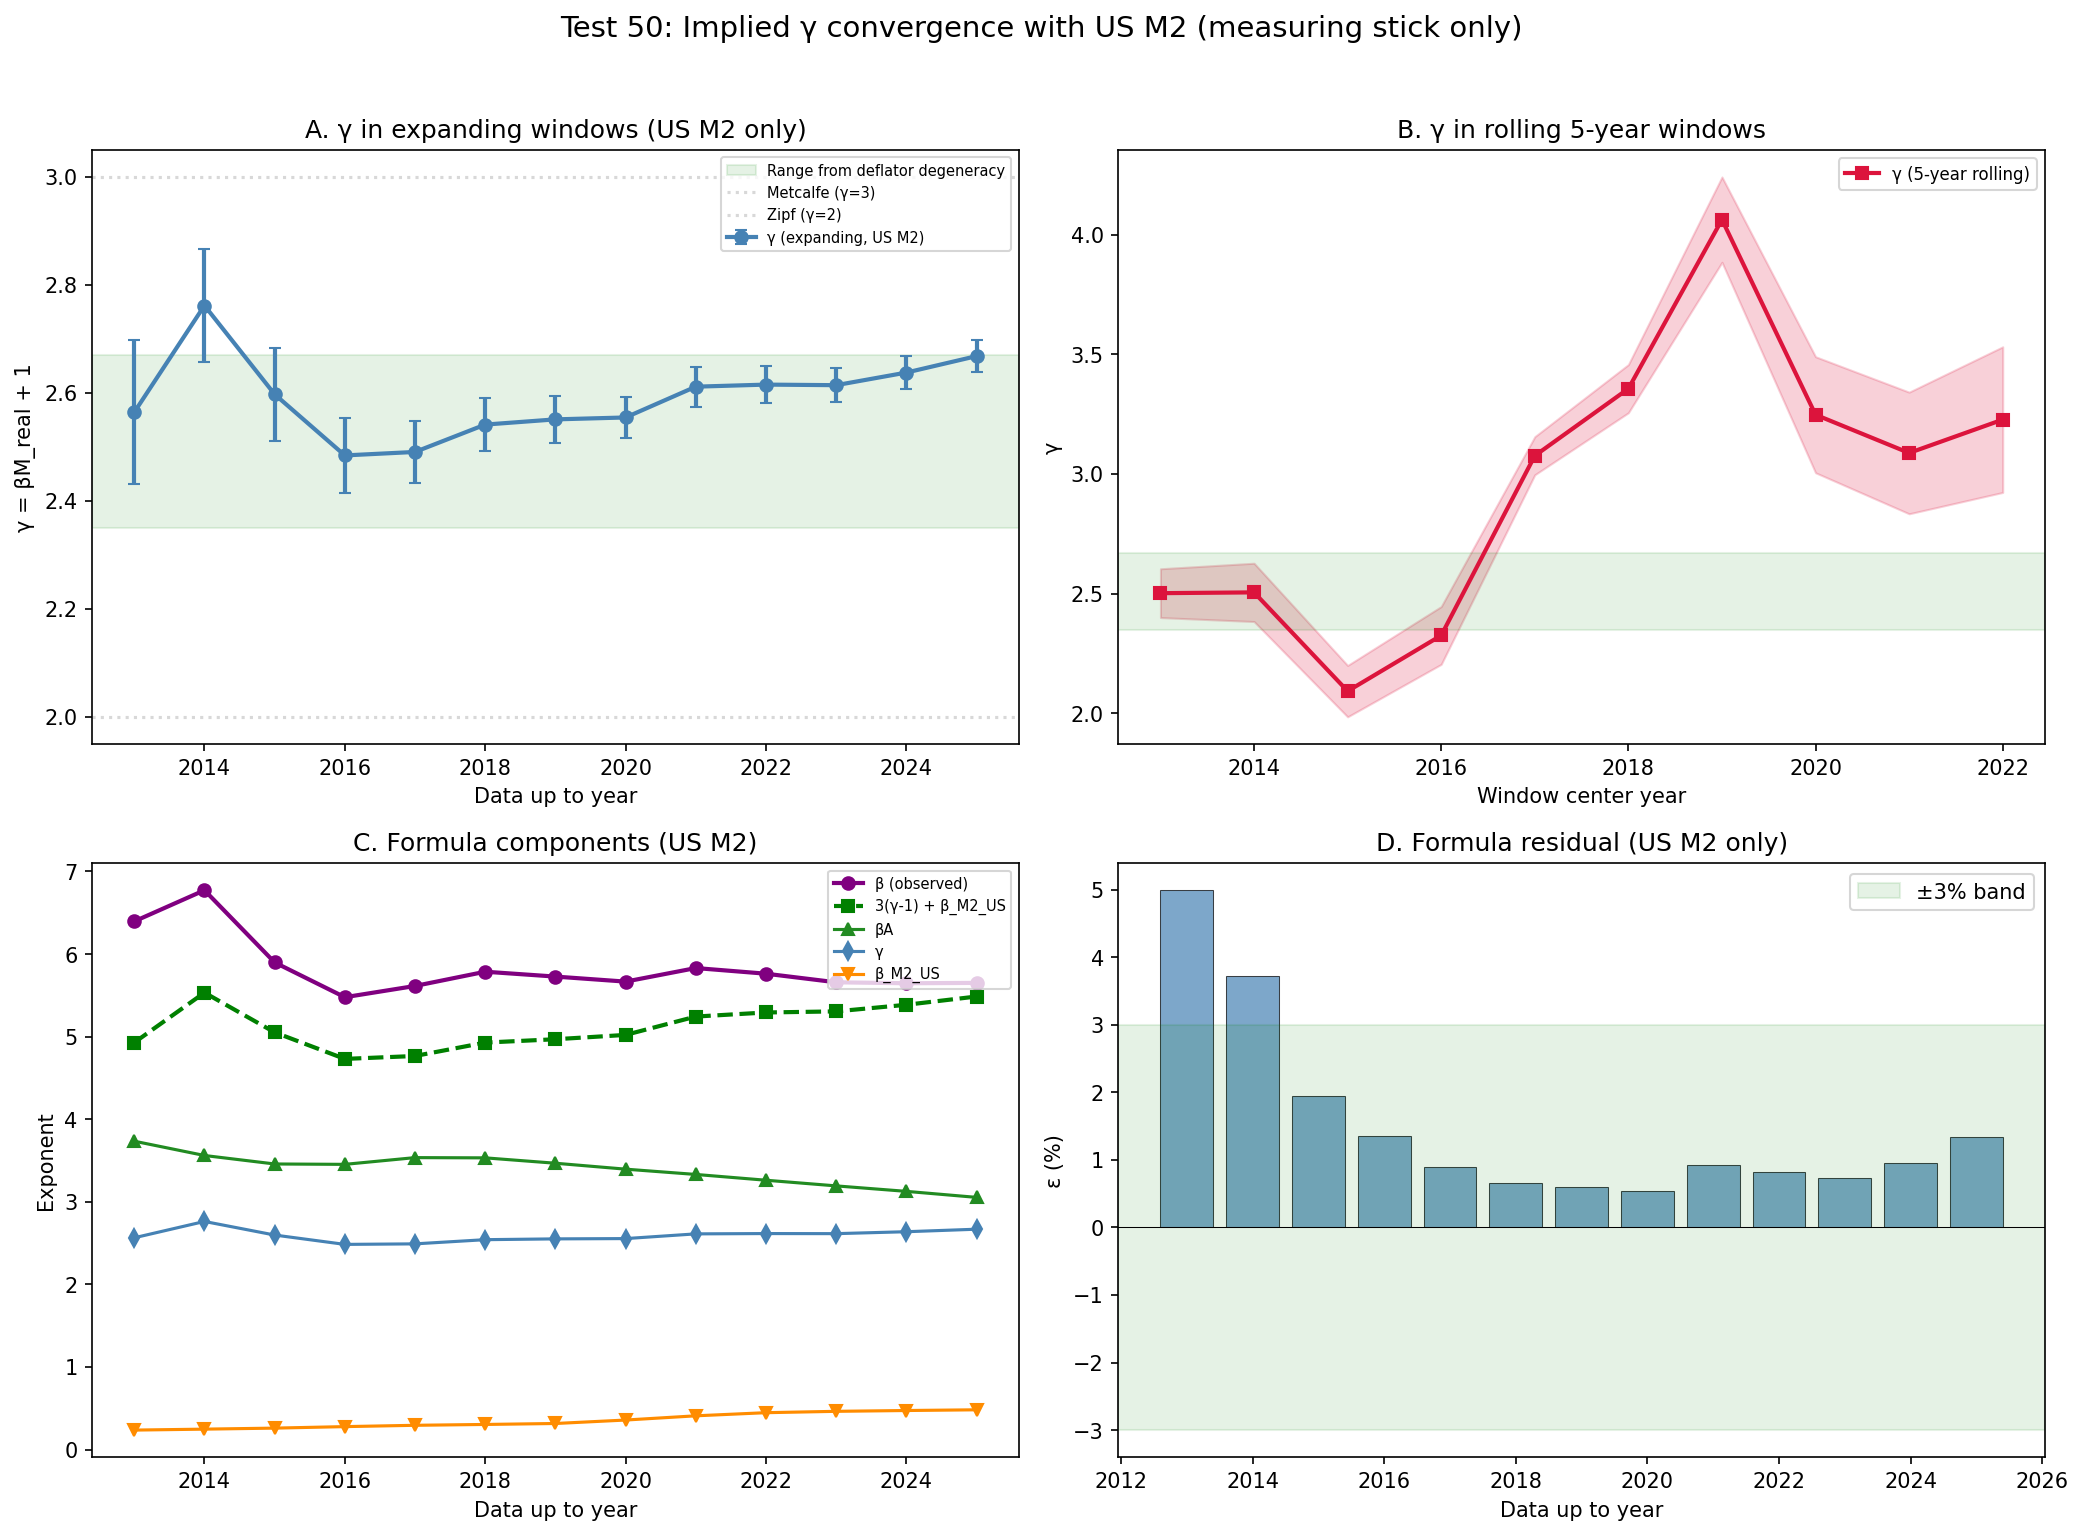
Test 50 superseded
Gamma expanding
Implied gamma converges to 2.67 with no trend (p = 0.50).

The adoption epidemic (betaA ~ 3)

Halving attenuation figure
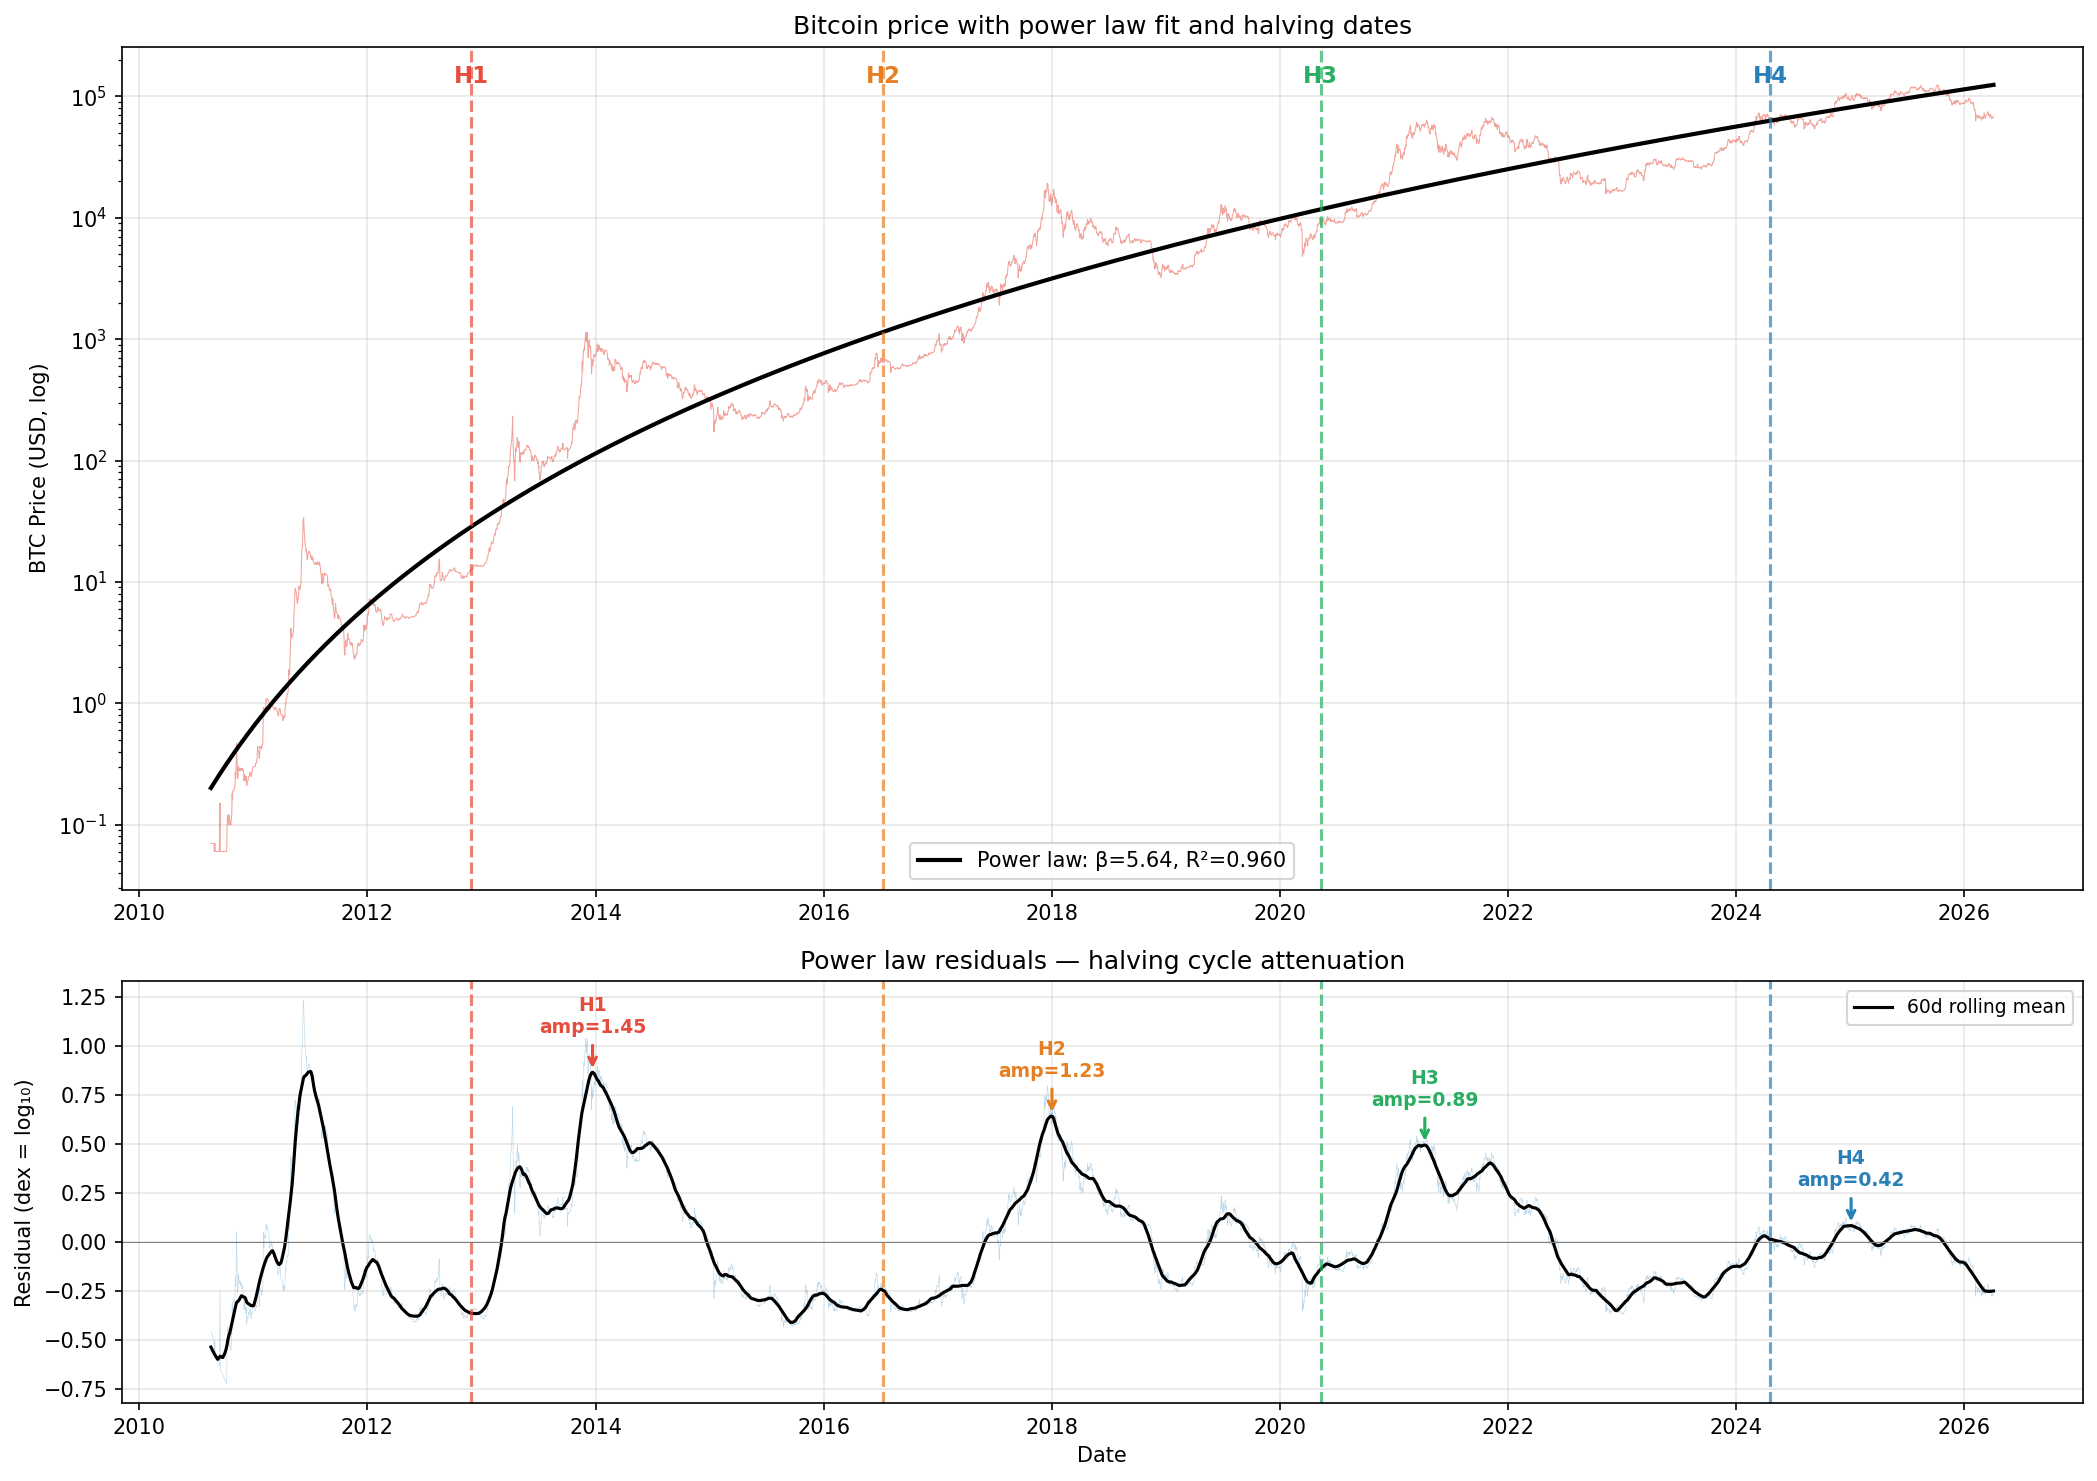
Test 7 corroborative
Halving attenuation
Post-halving bubbles shrink monotonically: 1.45 to 0.42 dex.
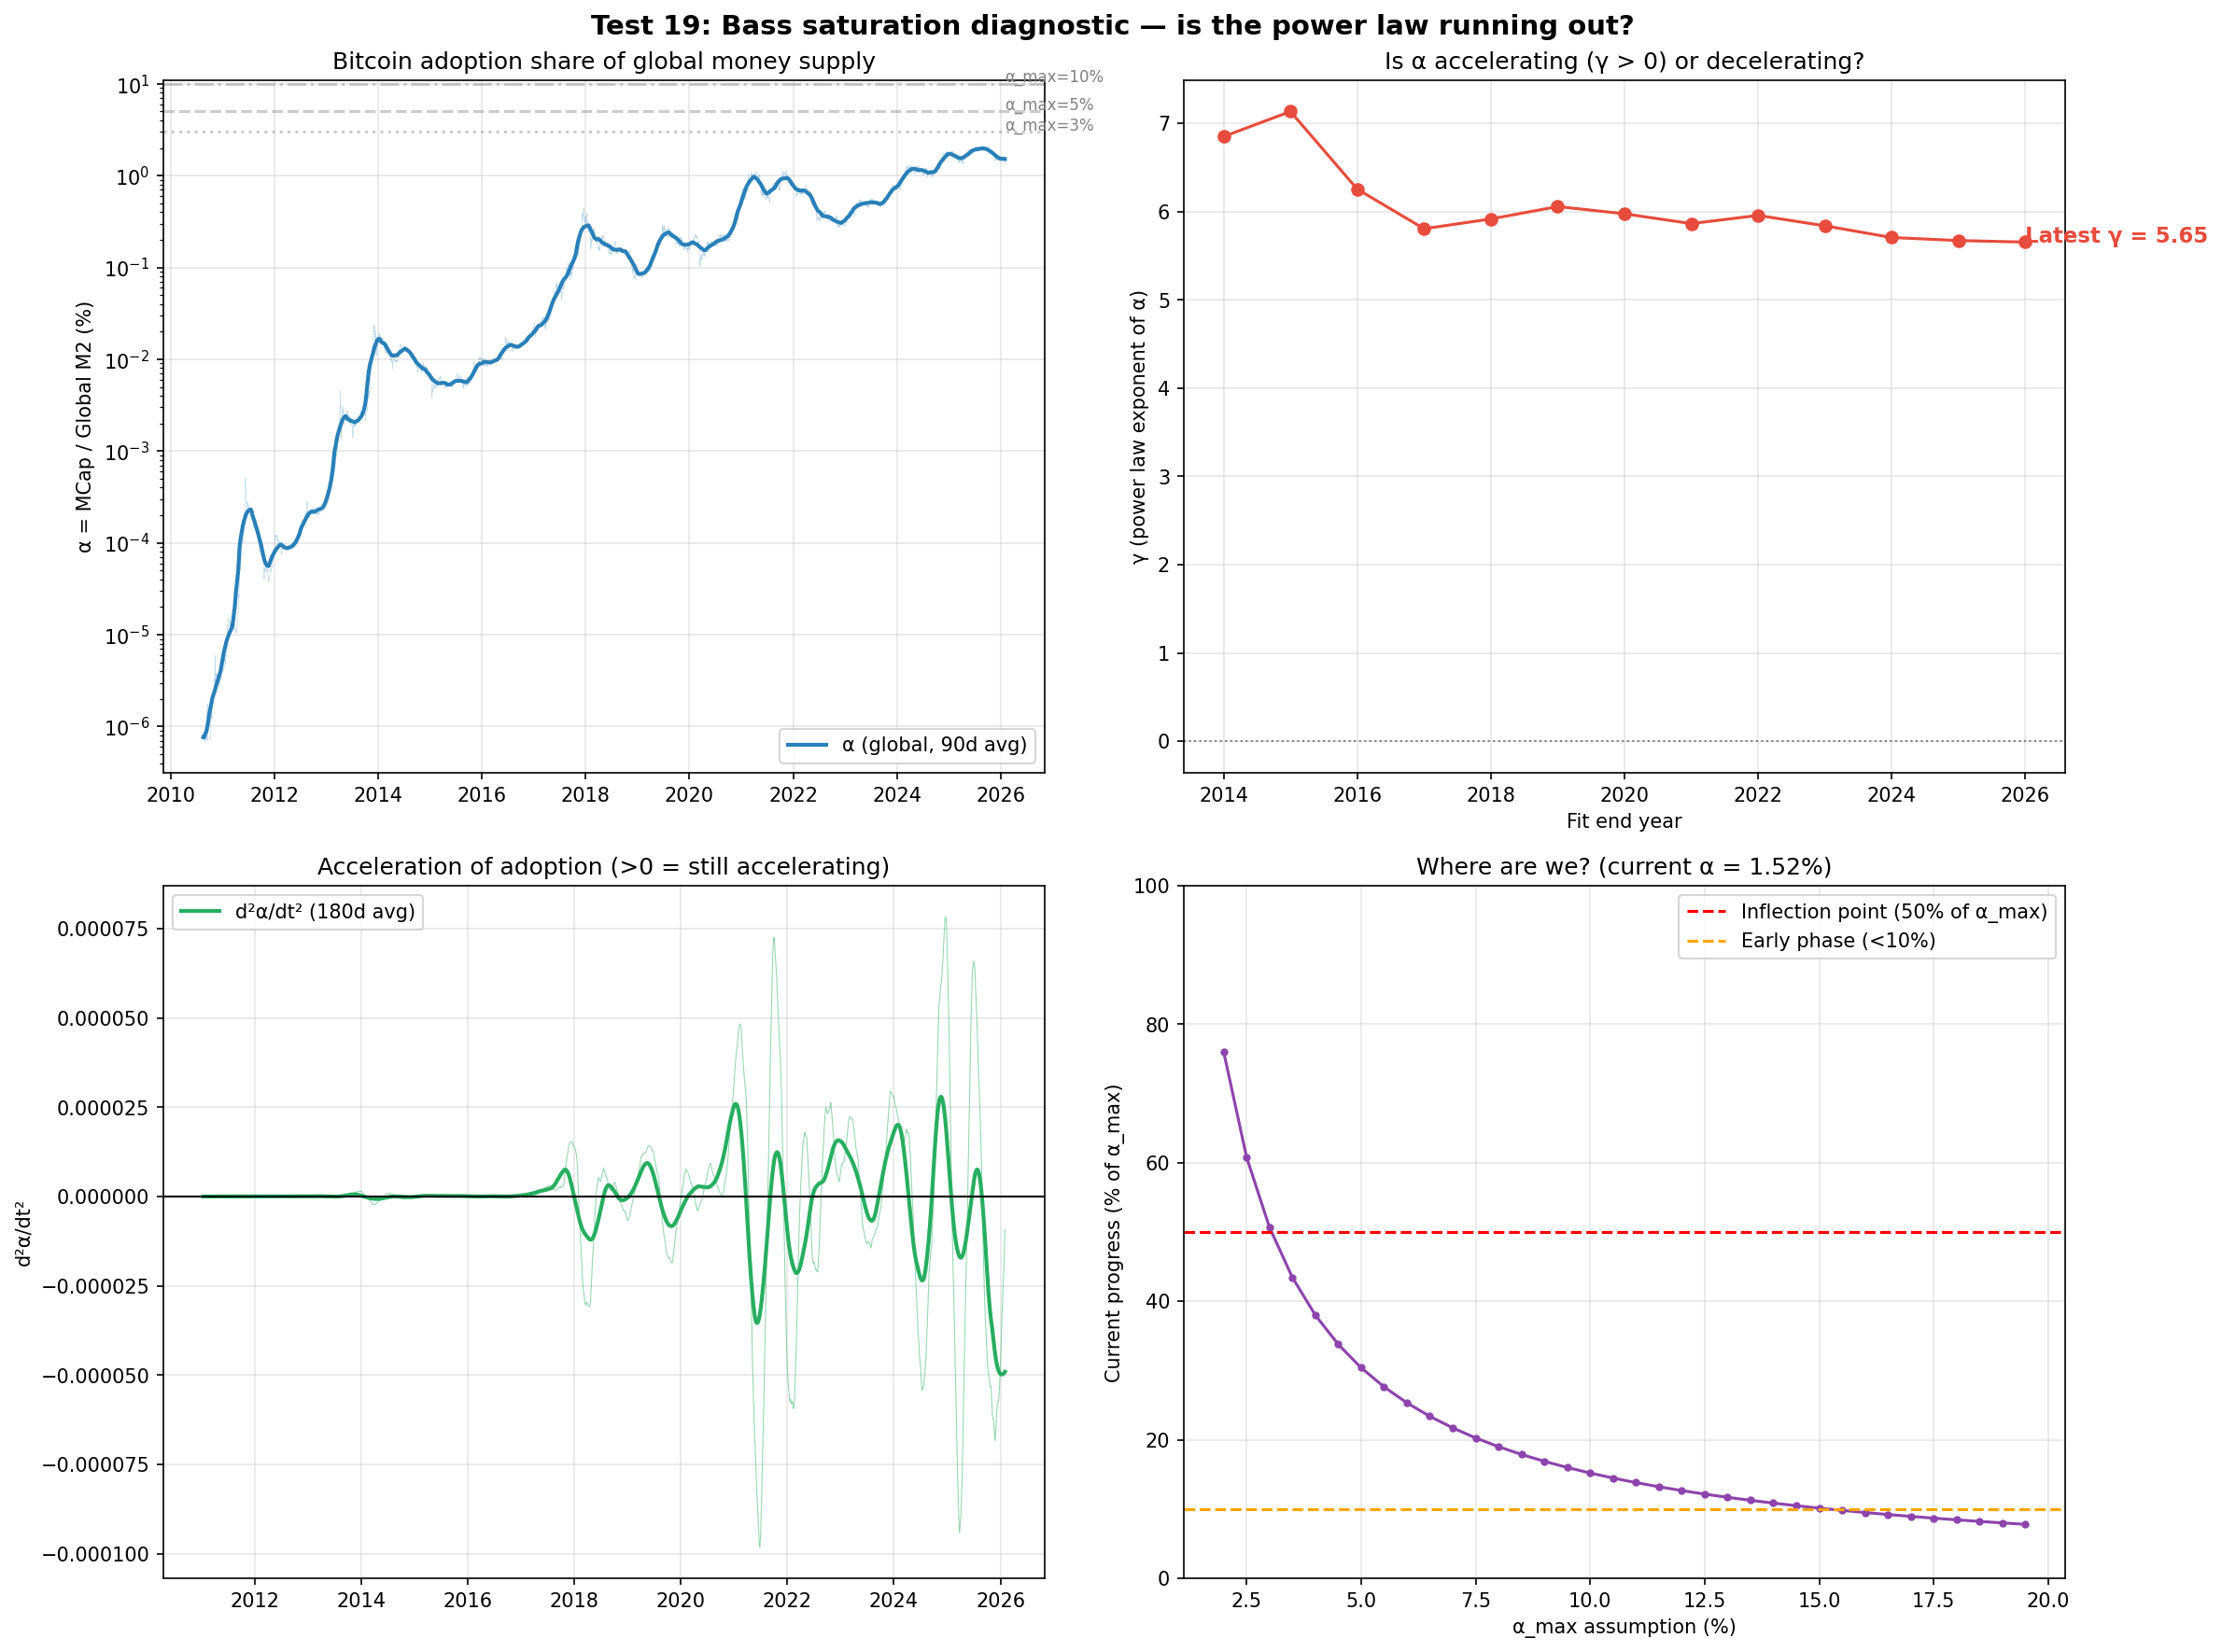
Bass saturation figure
Test 19 corroborative
Bass saturation
Bitcoin's share of global money is still accelerating (1.52%).
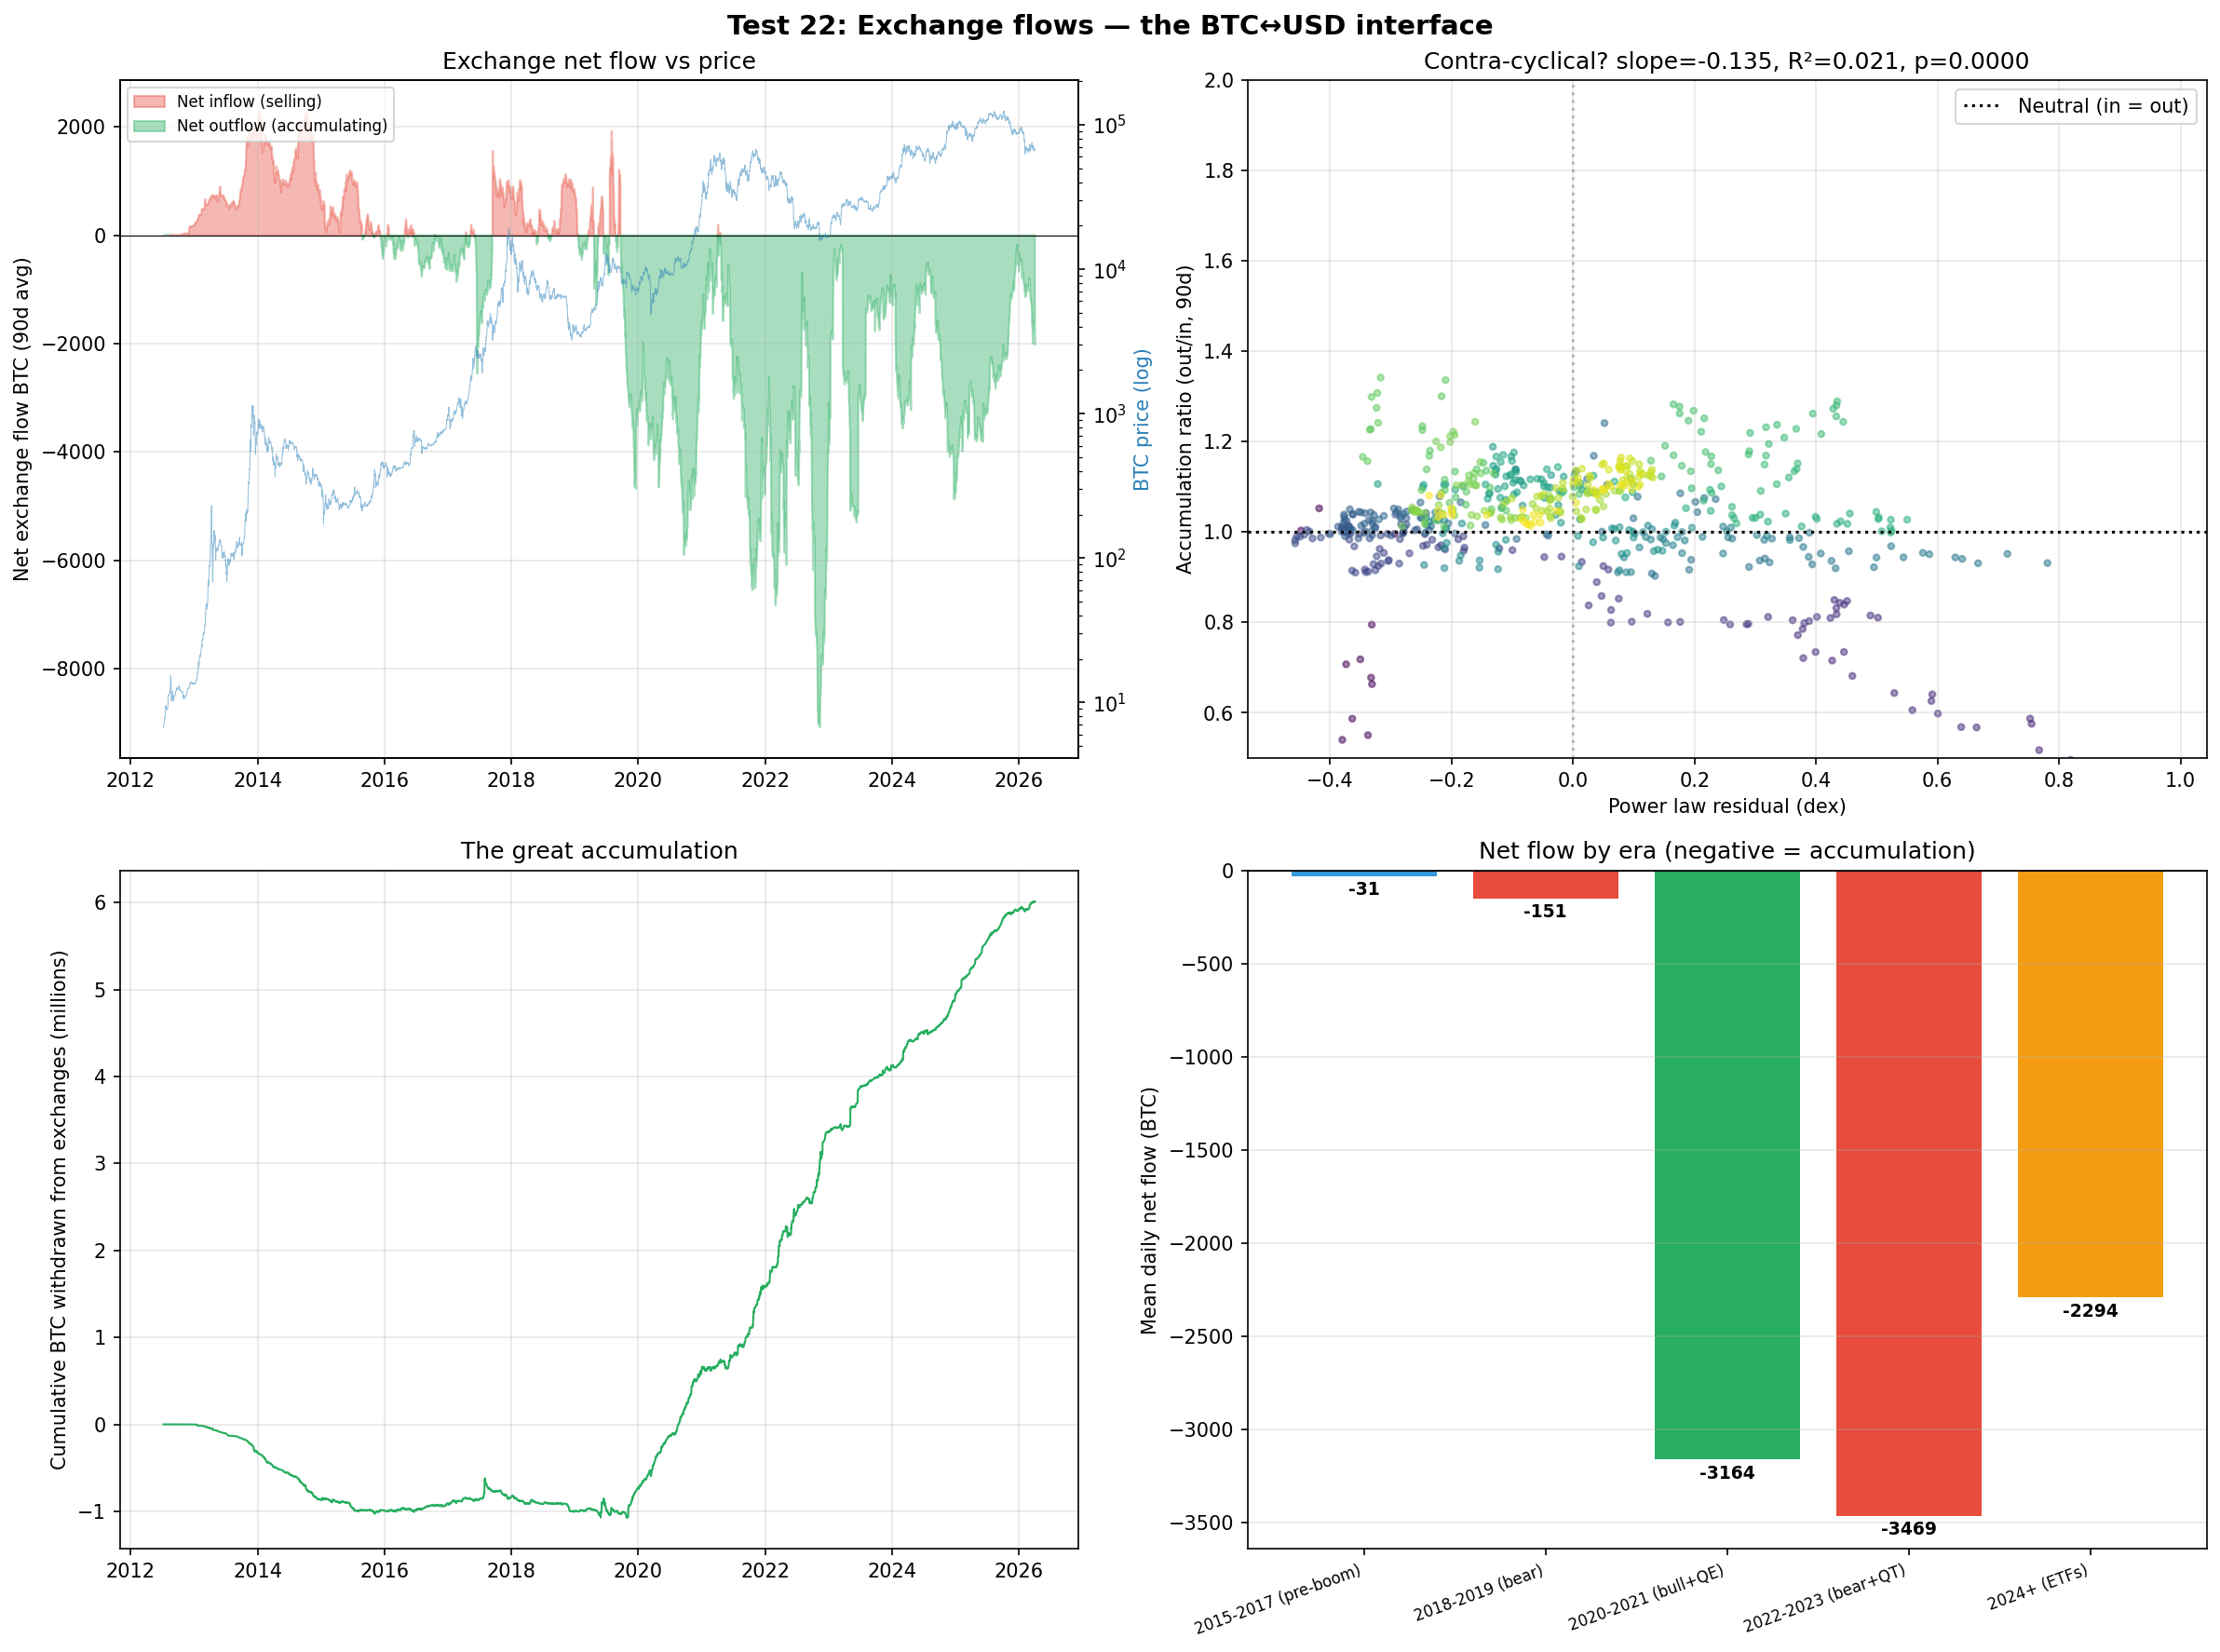
Exchange flows figure
Test 22 corroborative
Exchange flows
Contra-cyclical accumulation; outflow grows as t^3.55.
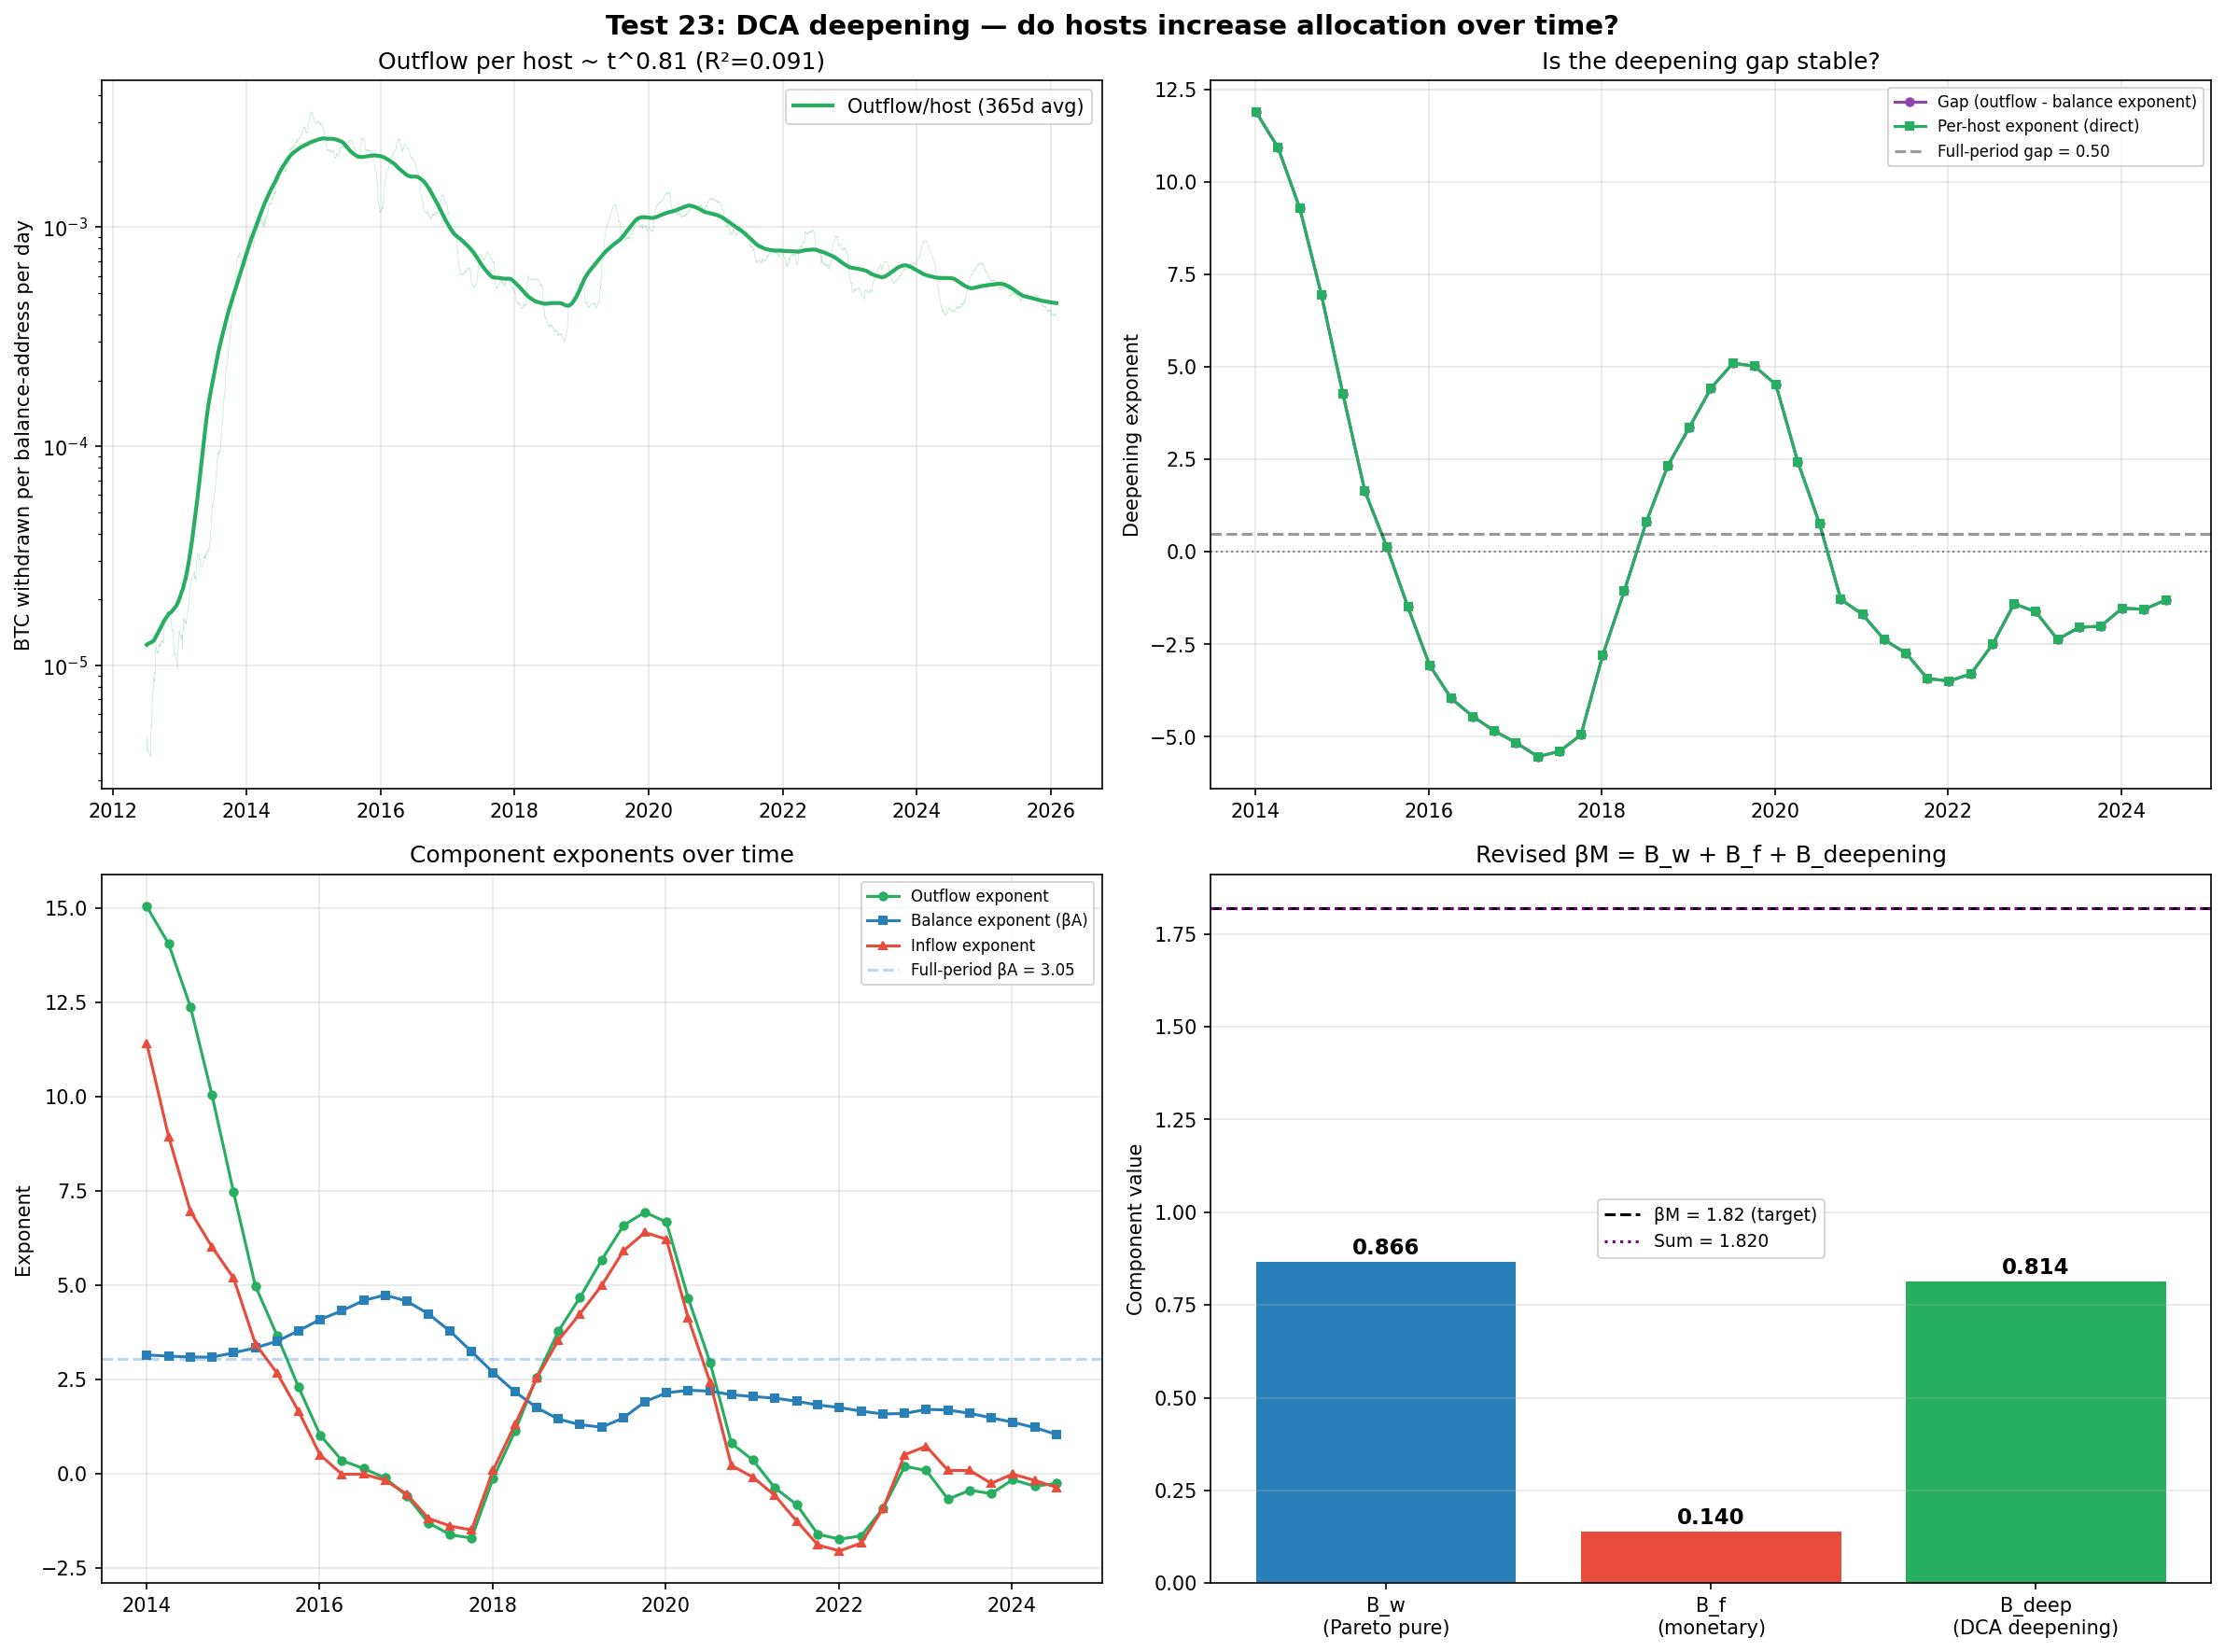
DCA deepening figure
Test 23 corroborative
DCA deepening
Per-holder deepening exists but is too noisy to isolate.
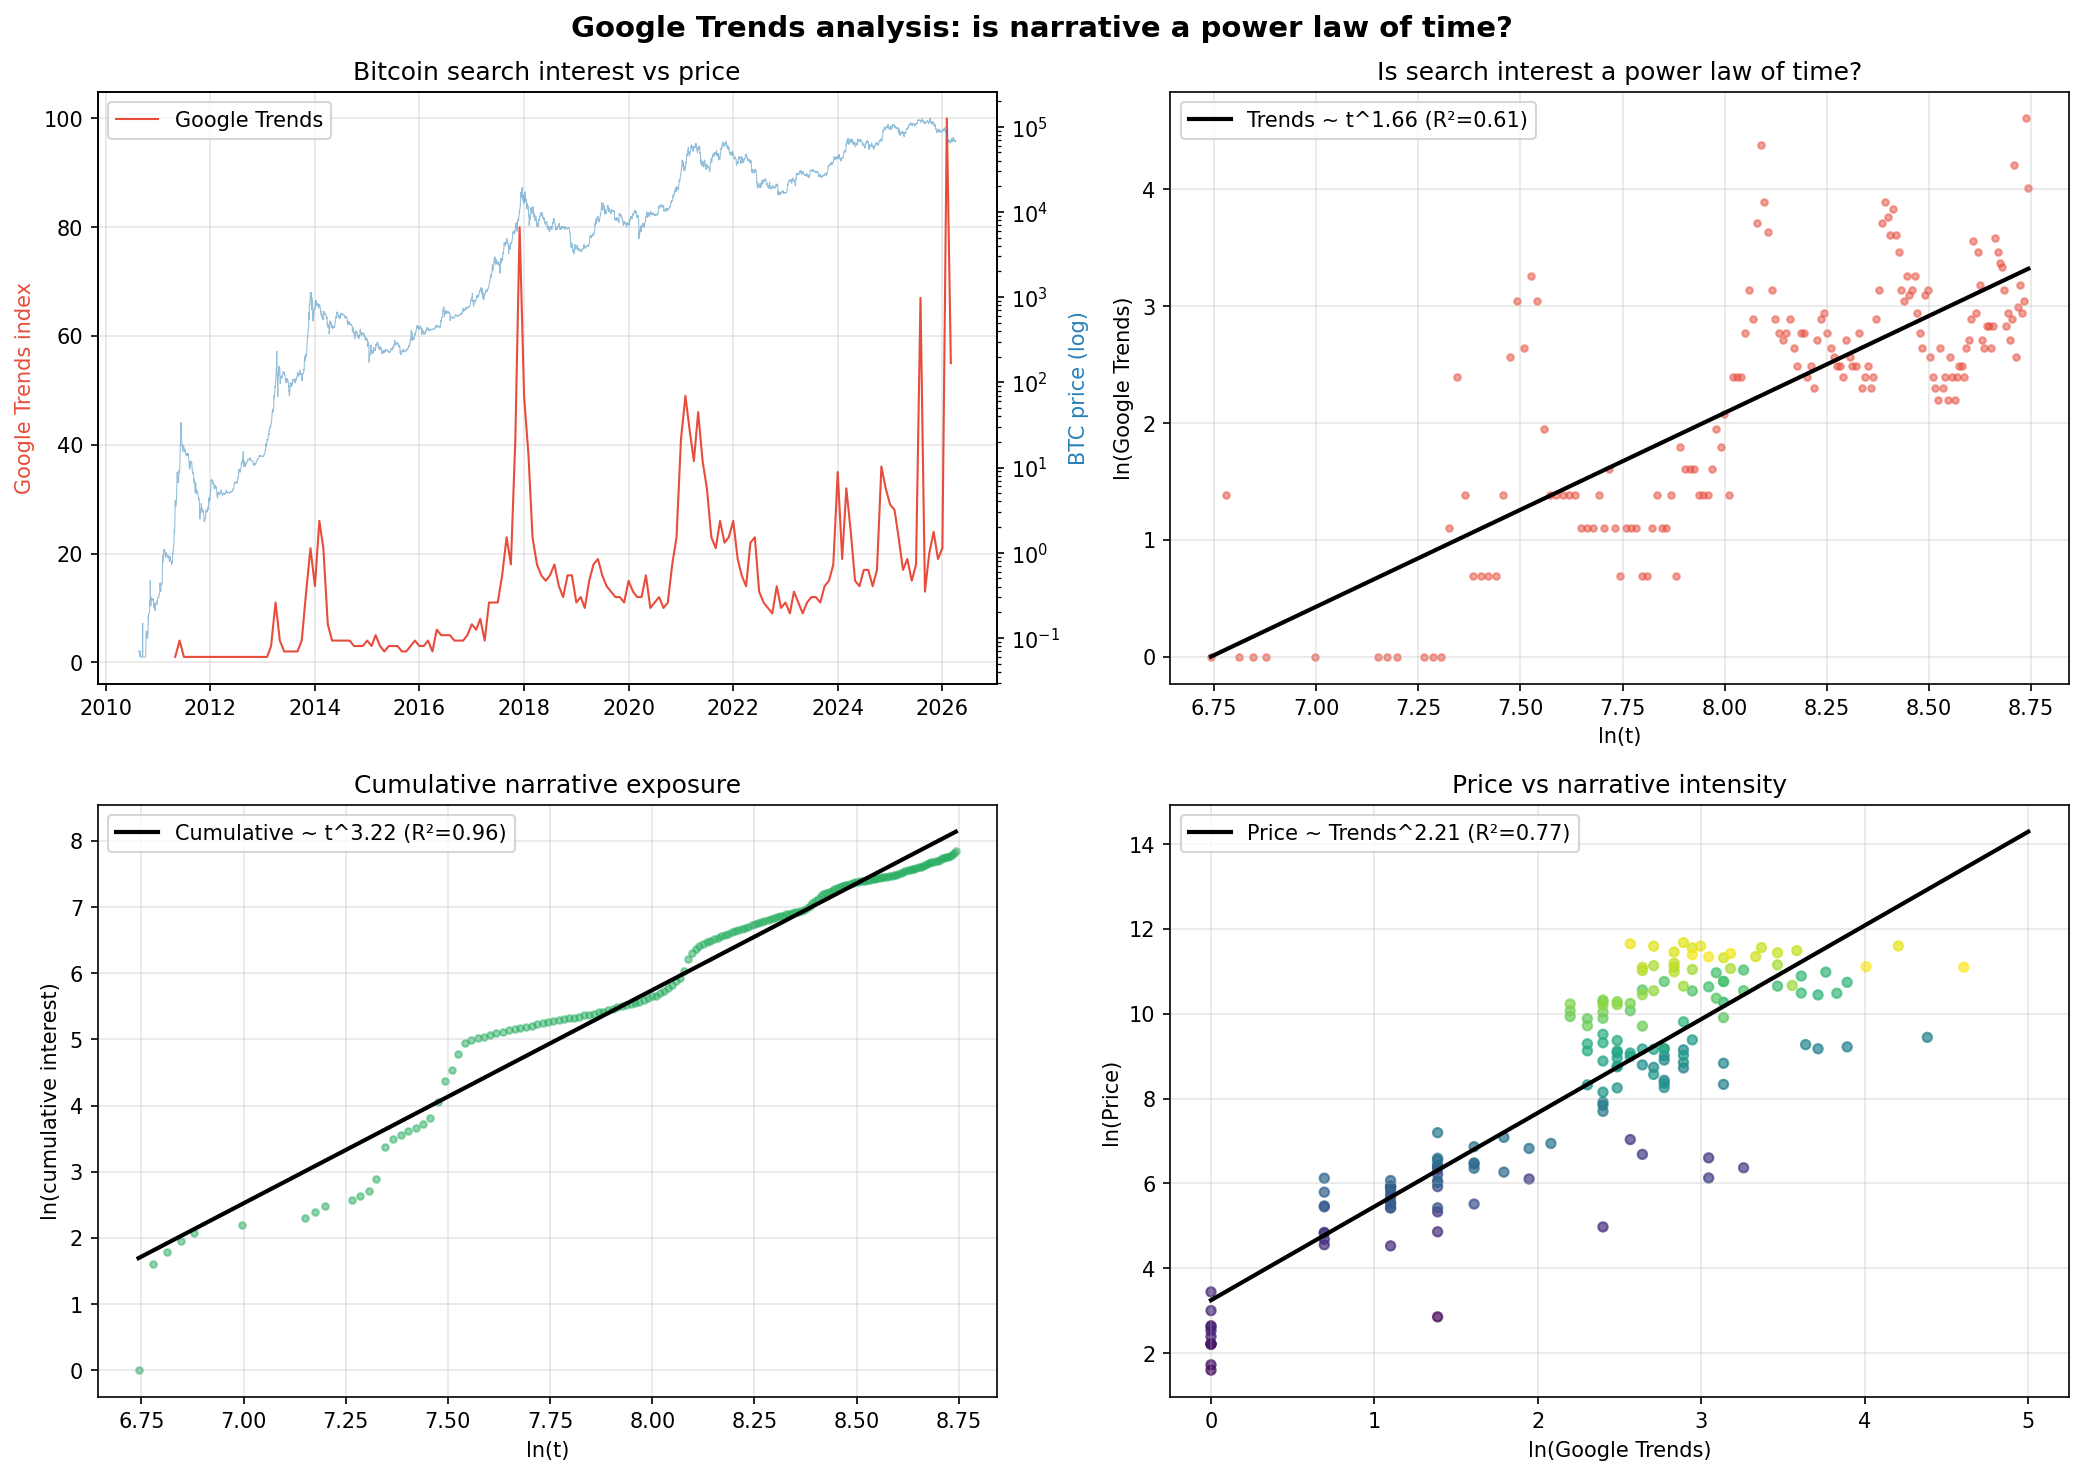
Google Trends figure
Test 24 ★ load-bearing
Google Trends
Cumulative narrative exposure grows as t^3.0-3.75 (R² > 0.94).
documentary — no figure
Test 25 corroborative
Adoption gradient
Every funnel stage (curiosity to custody) follows ~t³.
documentary — no figure
Test 26 corroborative
ETF vs exchange flows
No paper-Bitcoin signal; ETFs are 38% of exchange flow.
documentary — no figure
Test 27 corroborative
Institutional holdings
3.82M BTC institutional (19.3% of supply); MSTR is 61% of corporate.
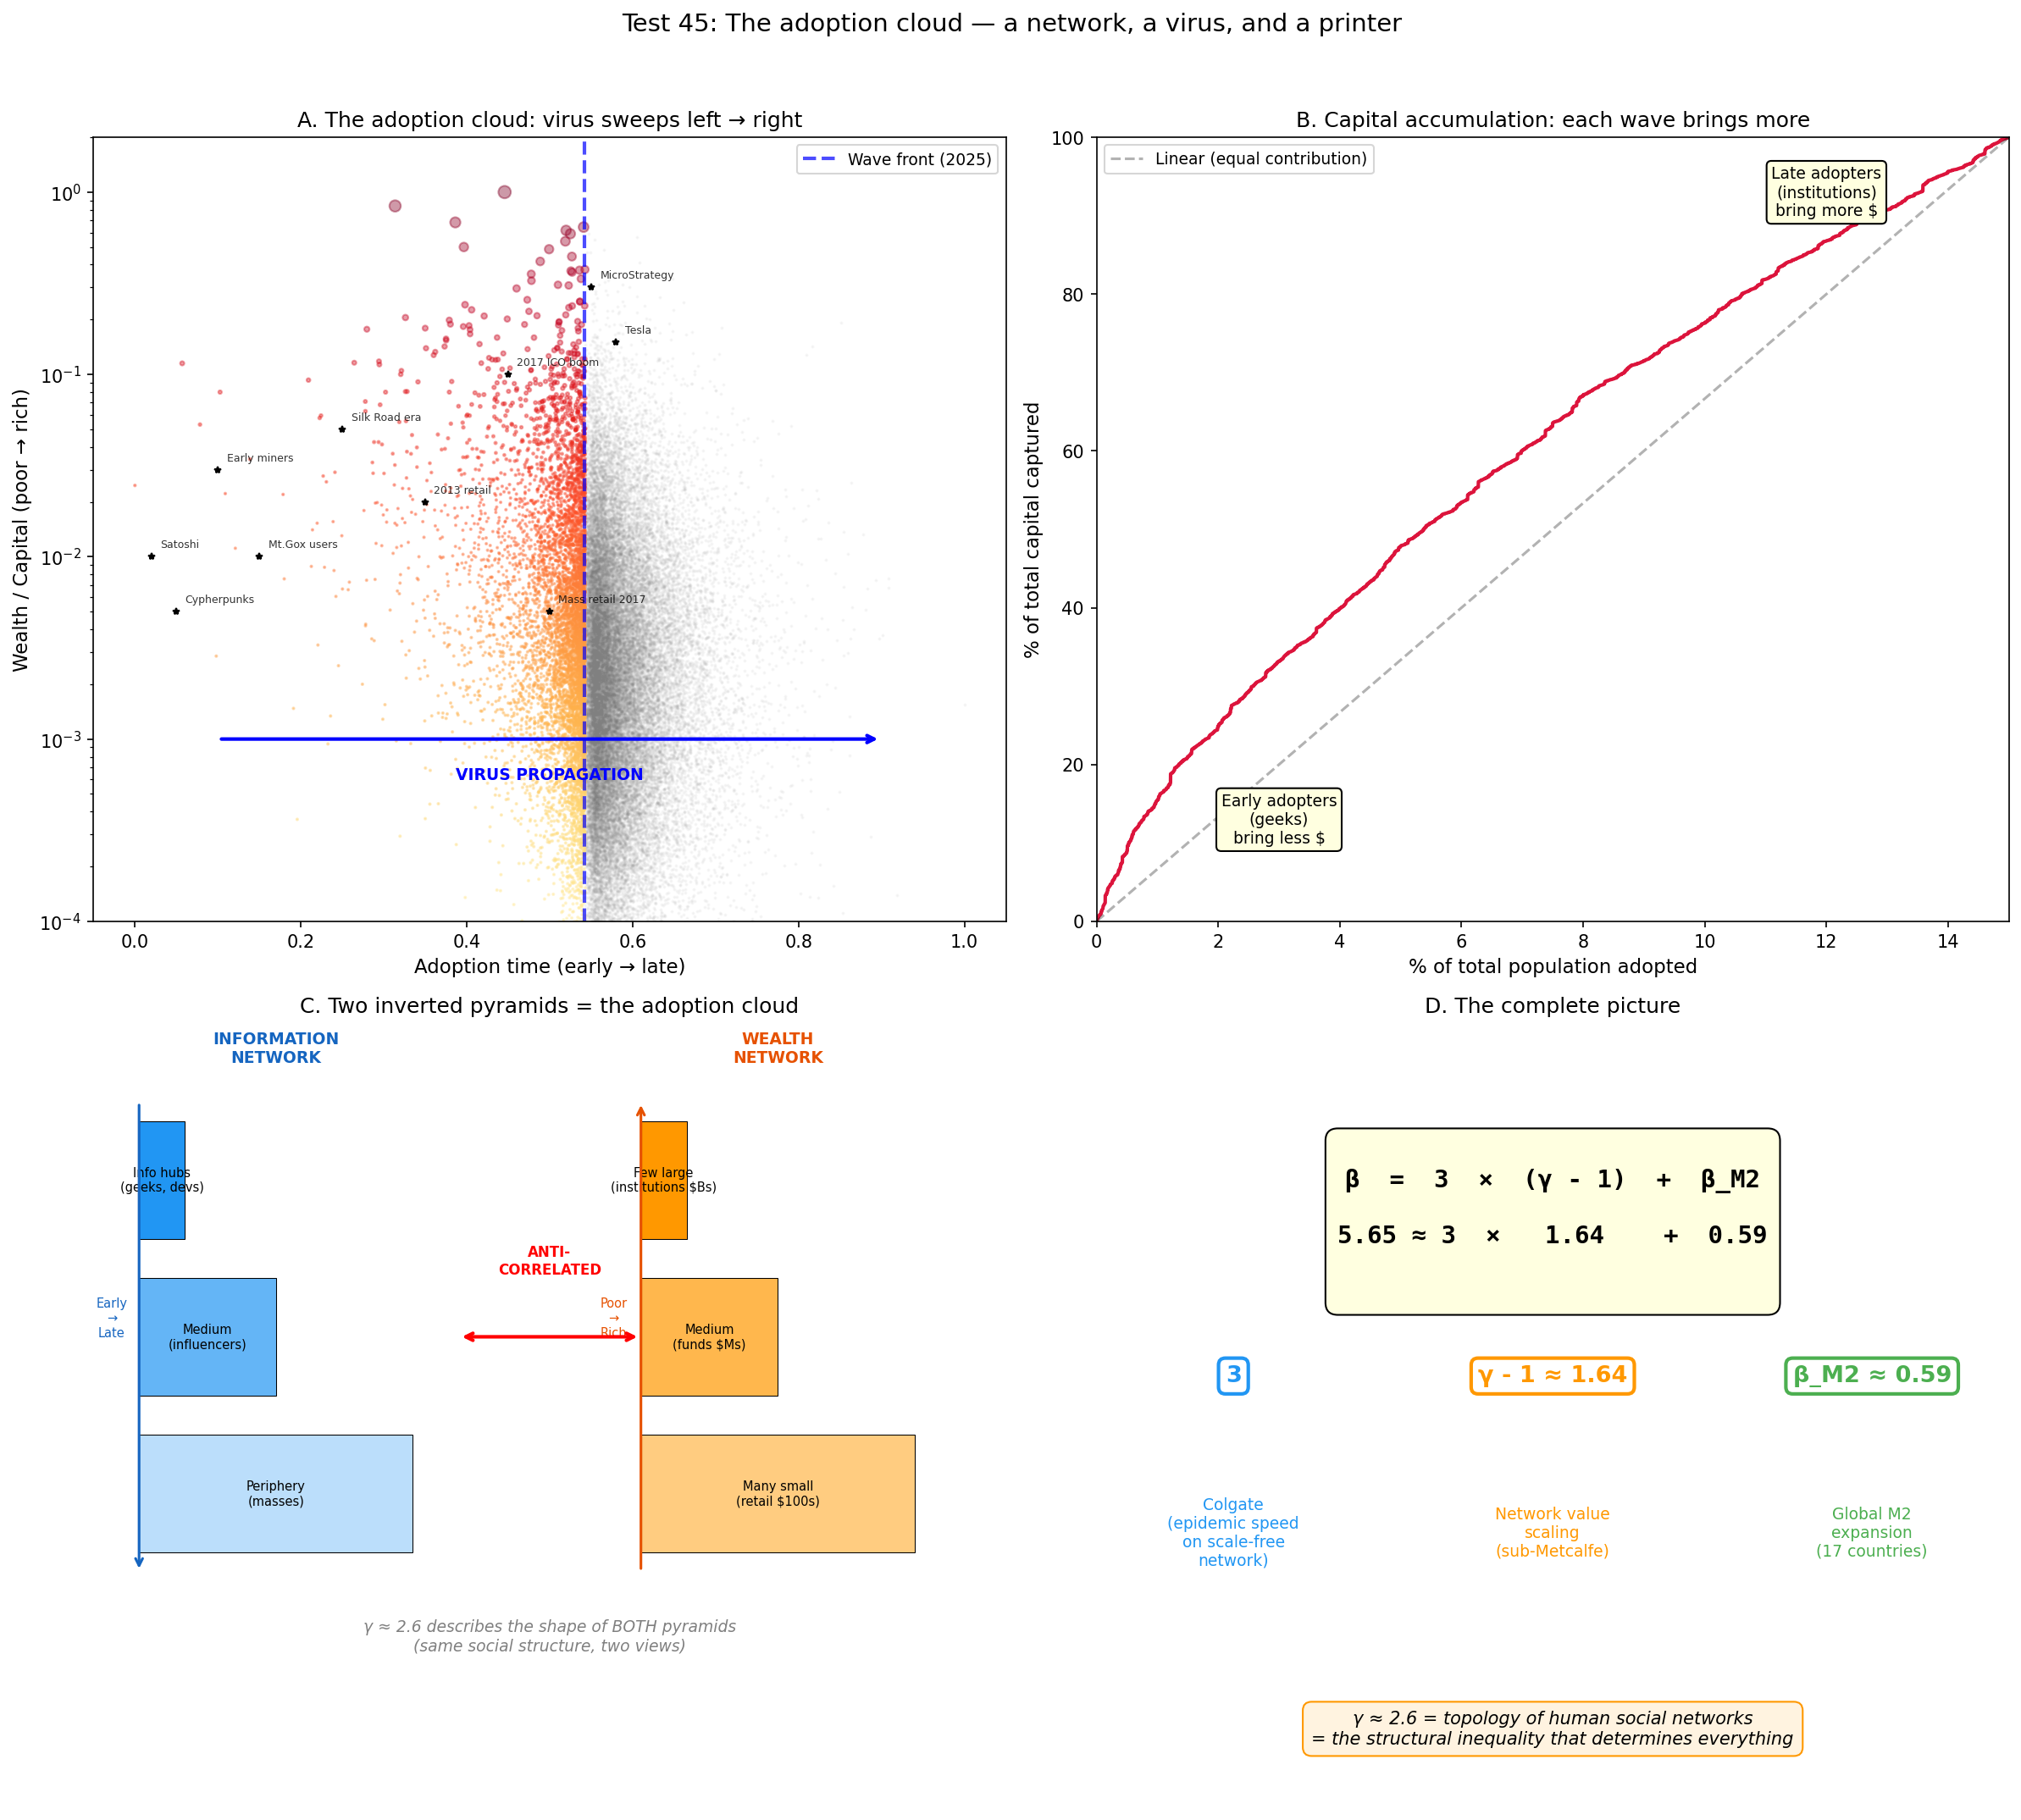
Adoption cloud figure
Test 45 corroborative
Adoption cloud
Conceptual visualization of adoption time x wealth.
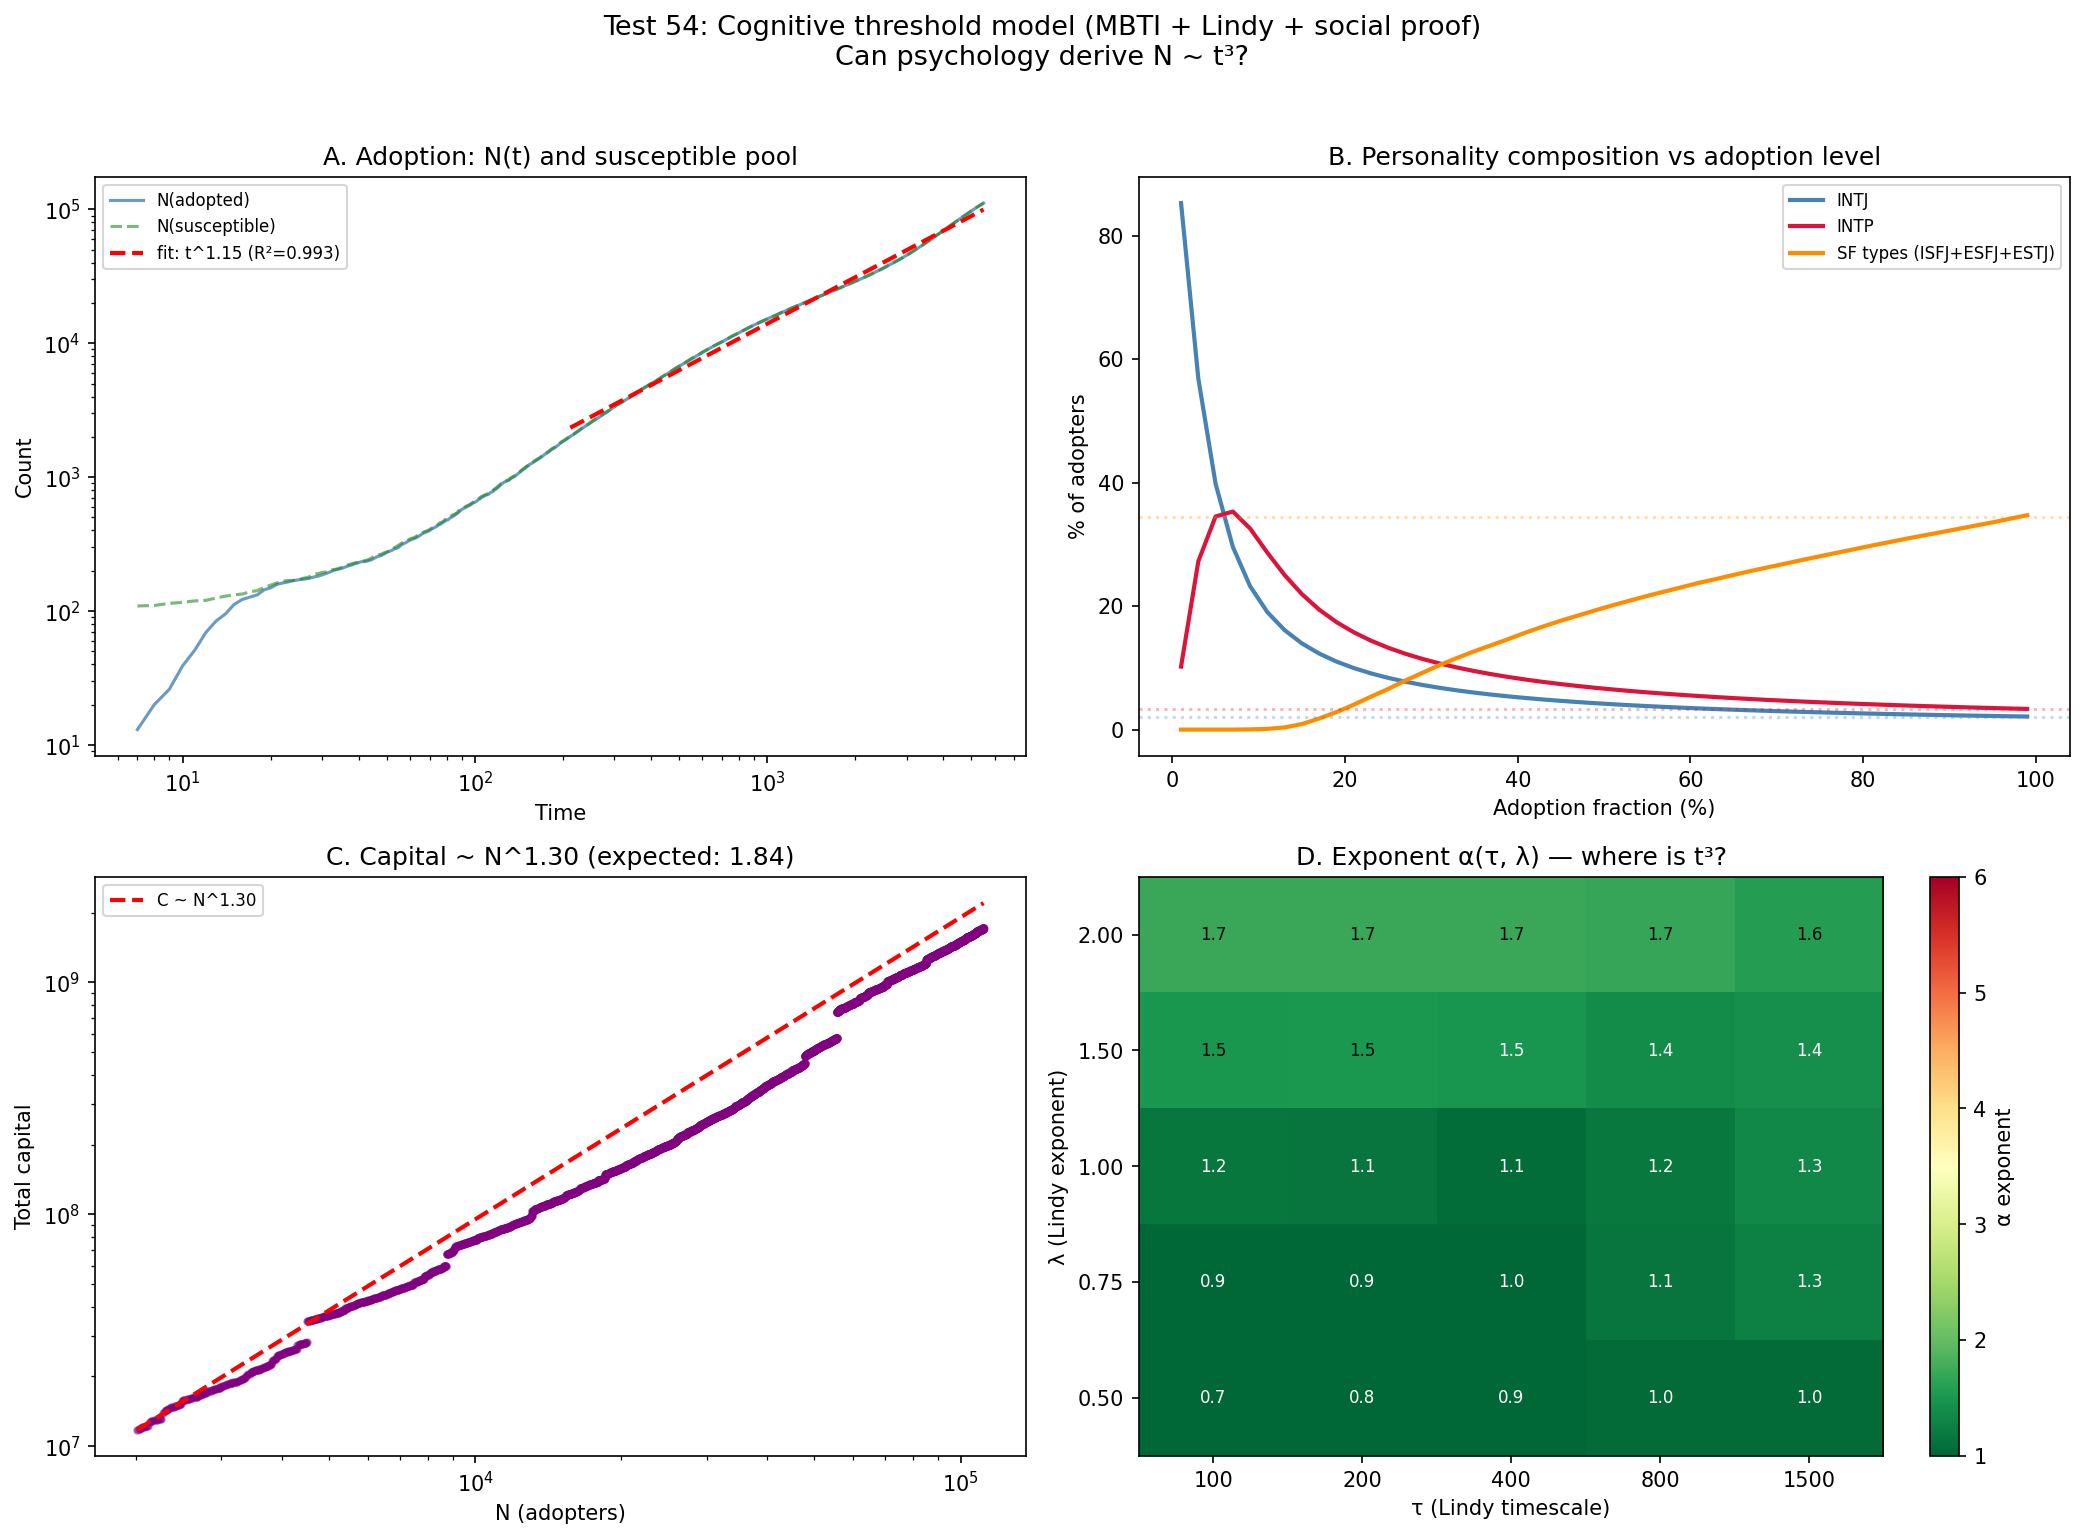
Cognitive thresholds figure
Test 54 corroborative
Cognitive thresholds
One psychological mechanism gives t^1.15, not t³ - three needed.
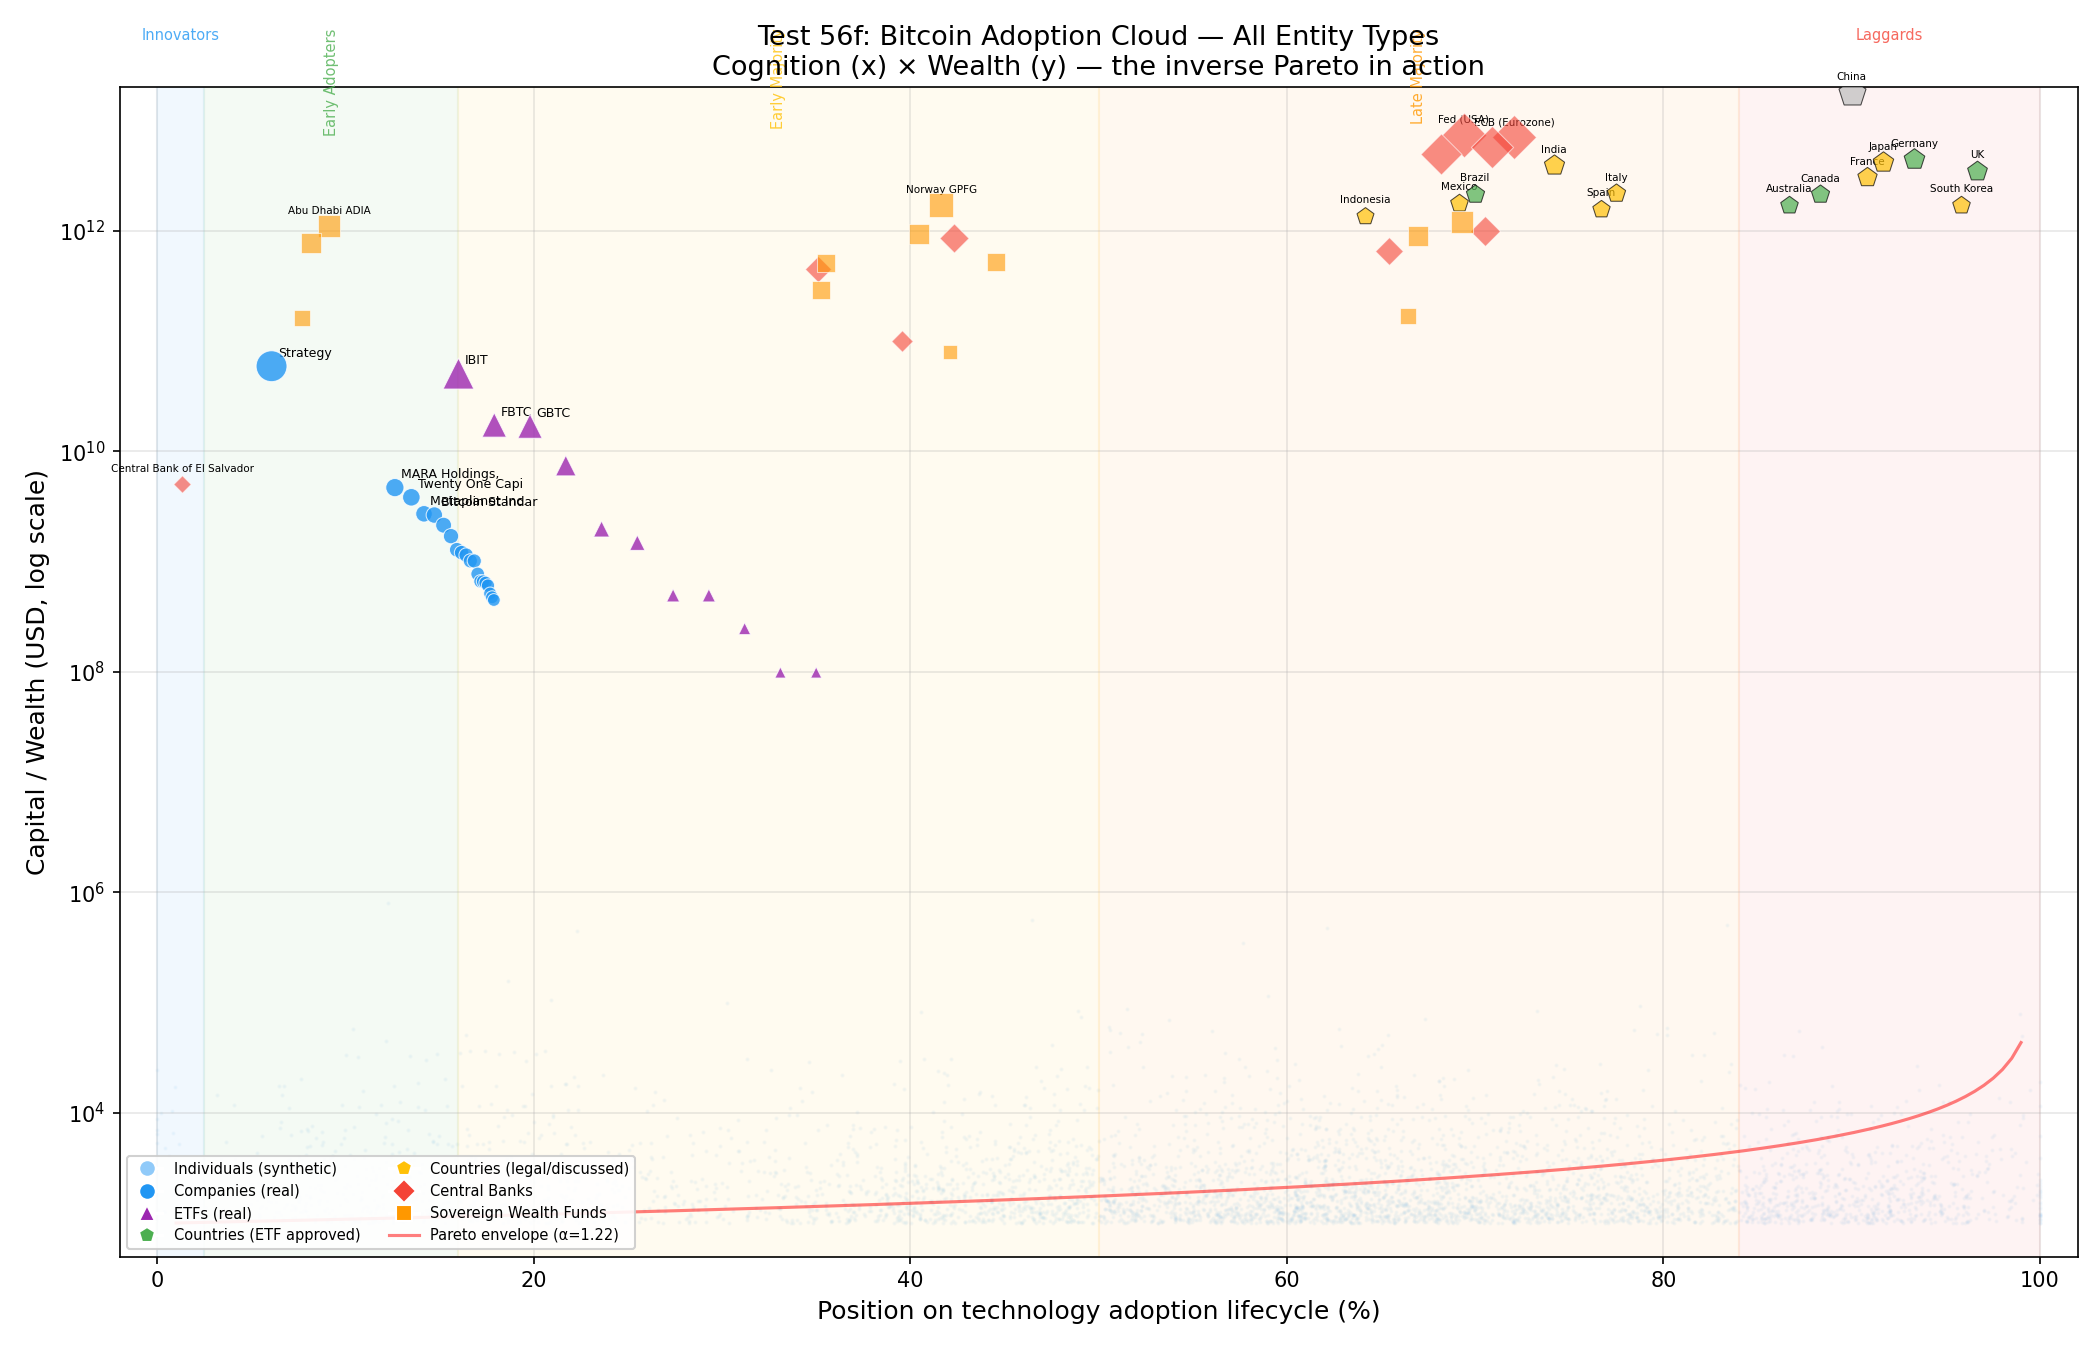
Adoption cloud v1 figure
Test 56 superseded
Adoption cloud v1
First combined cloud - superseded by the Test 57 series.
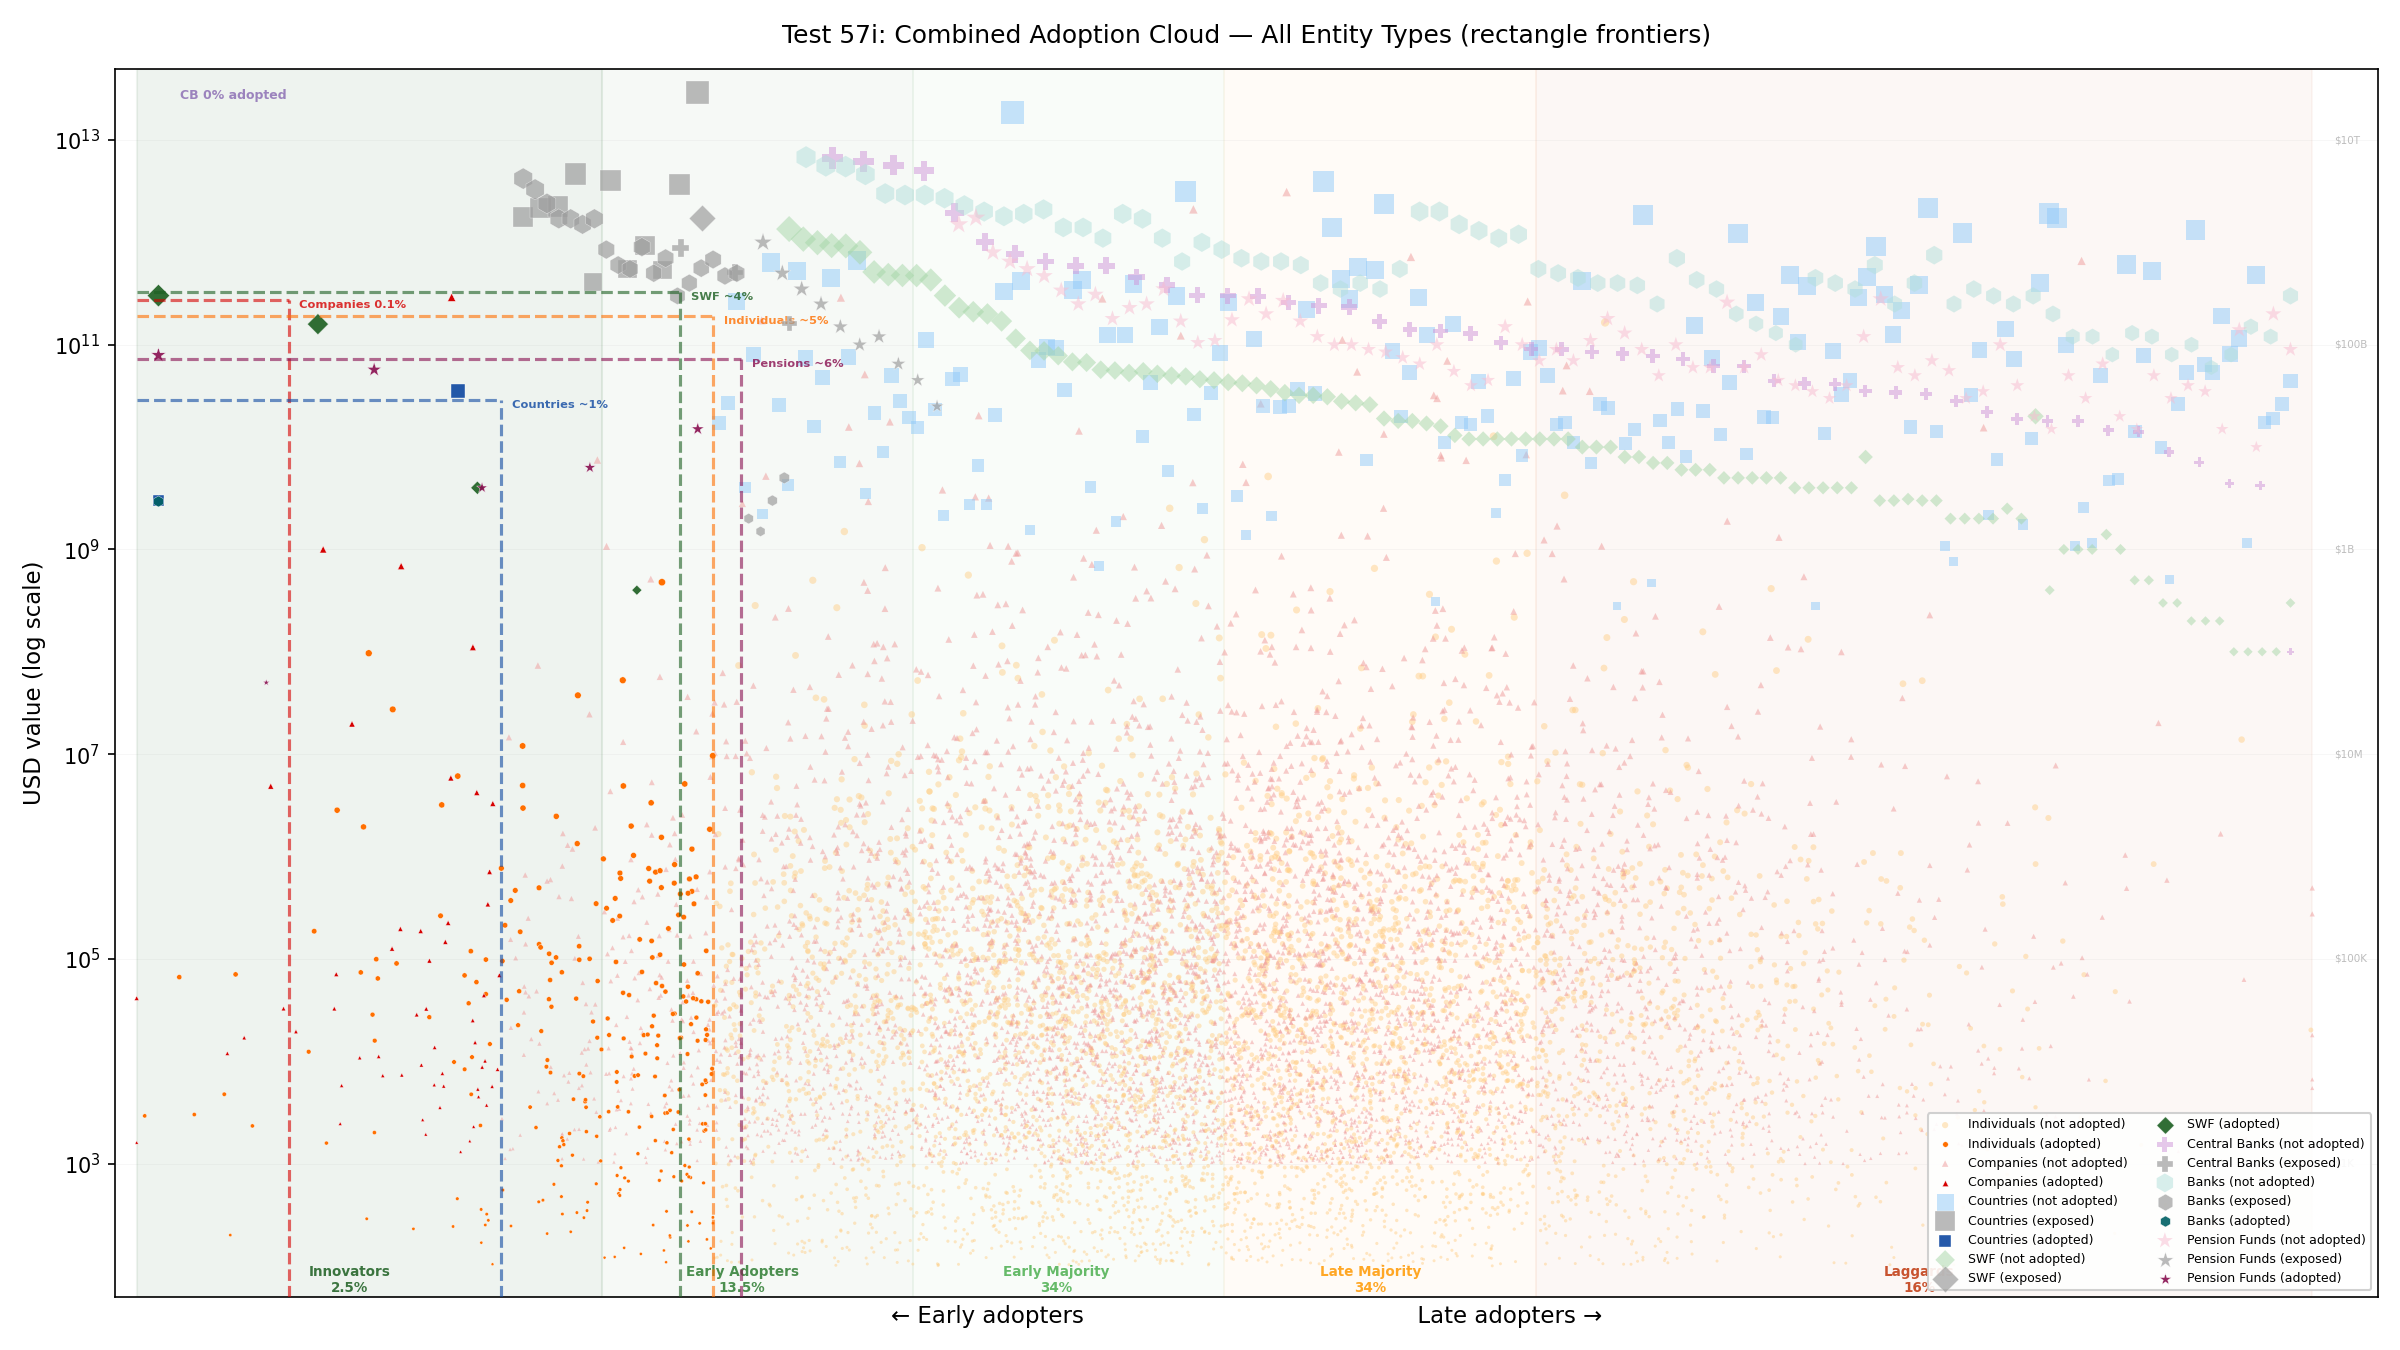
Global adoption clouds figure
Test 57 corroborative
Global adoption clouds
Eight entity classes: individuals ~5%, companies 0.13%, central banks 0%.
Wealth & Rogers figure
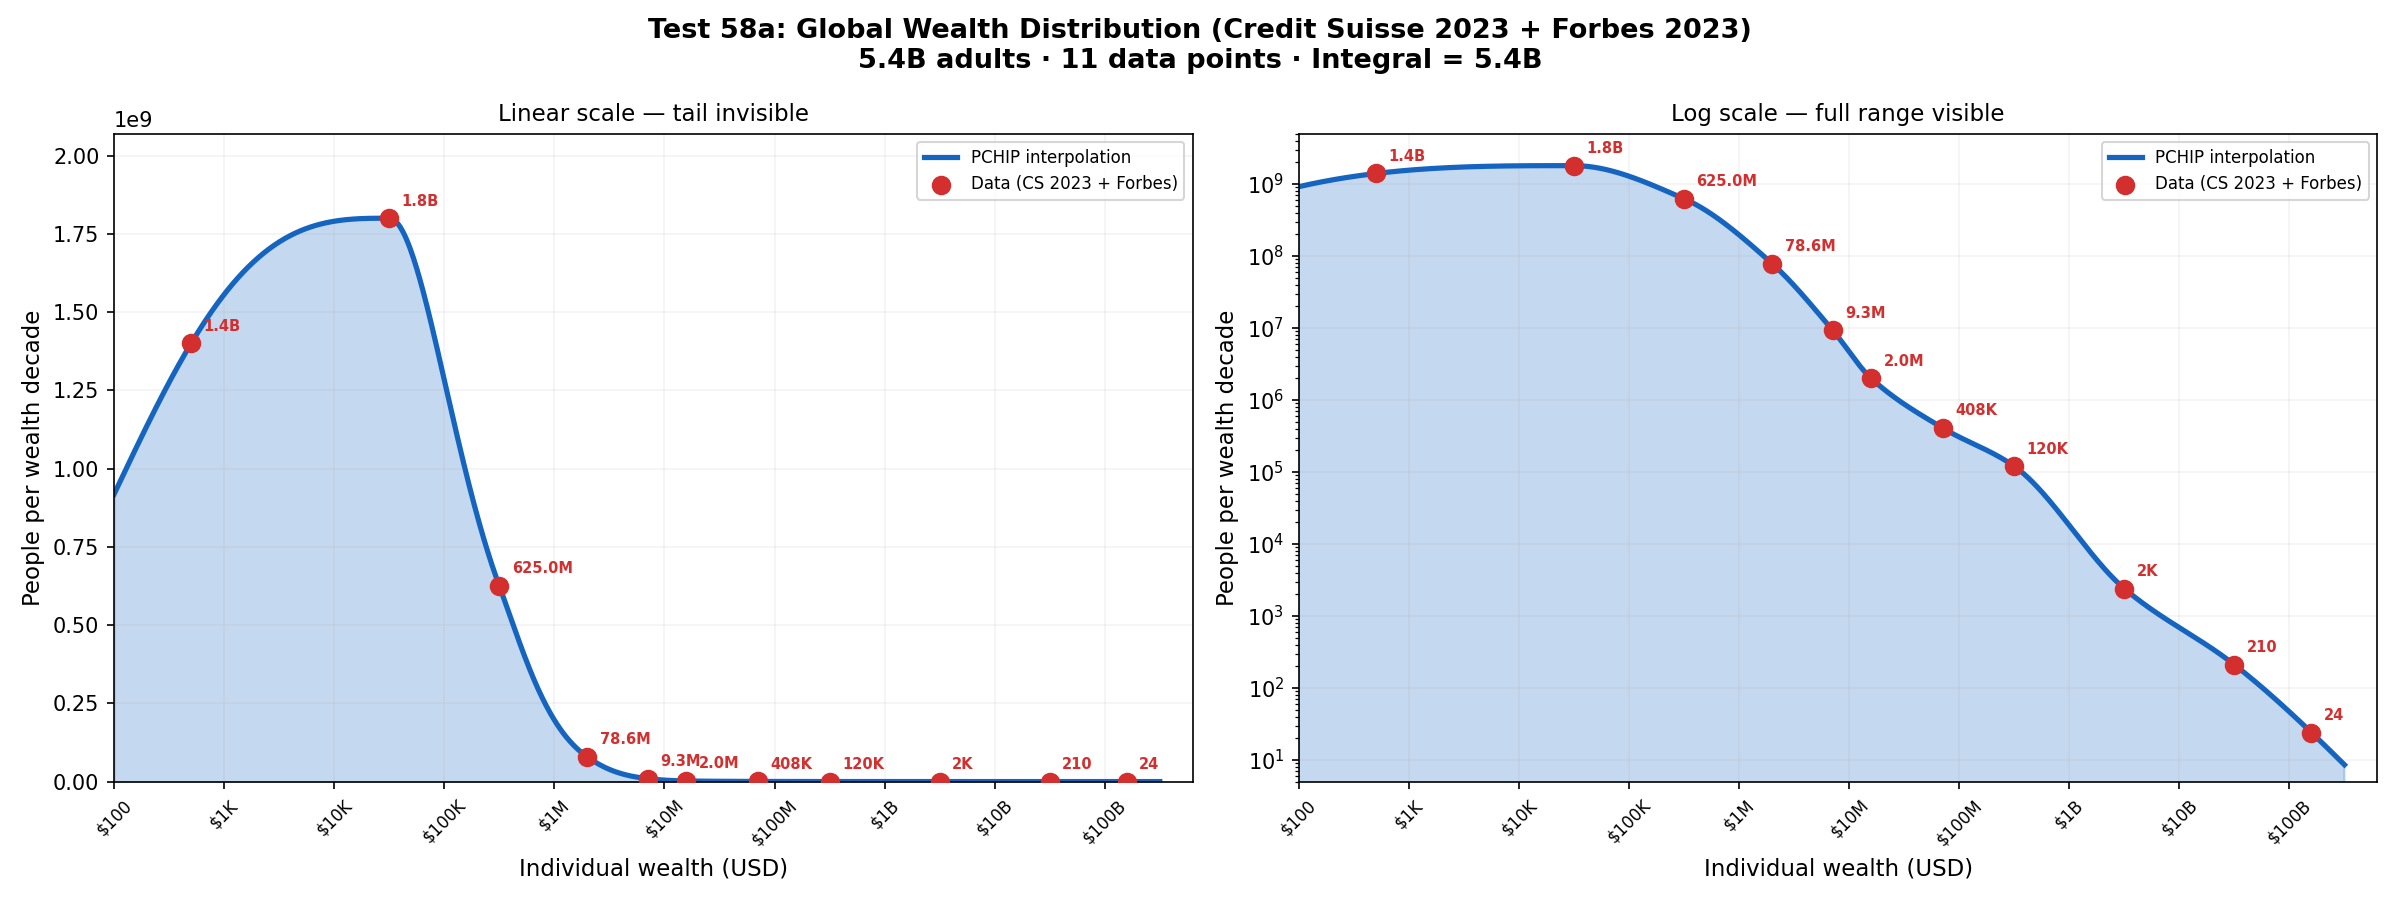
Test 58 corroborative
Wealth & Rogers
Background: global wealth pyramid and Rogers lifecycle.
GDP vs GII figure
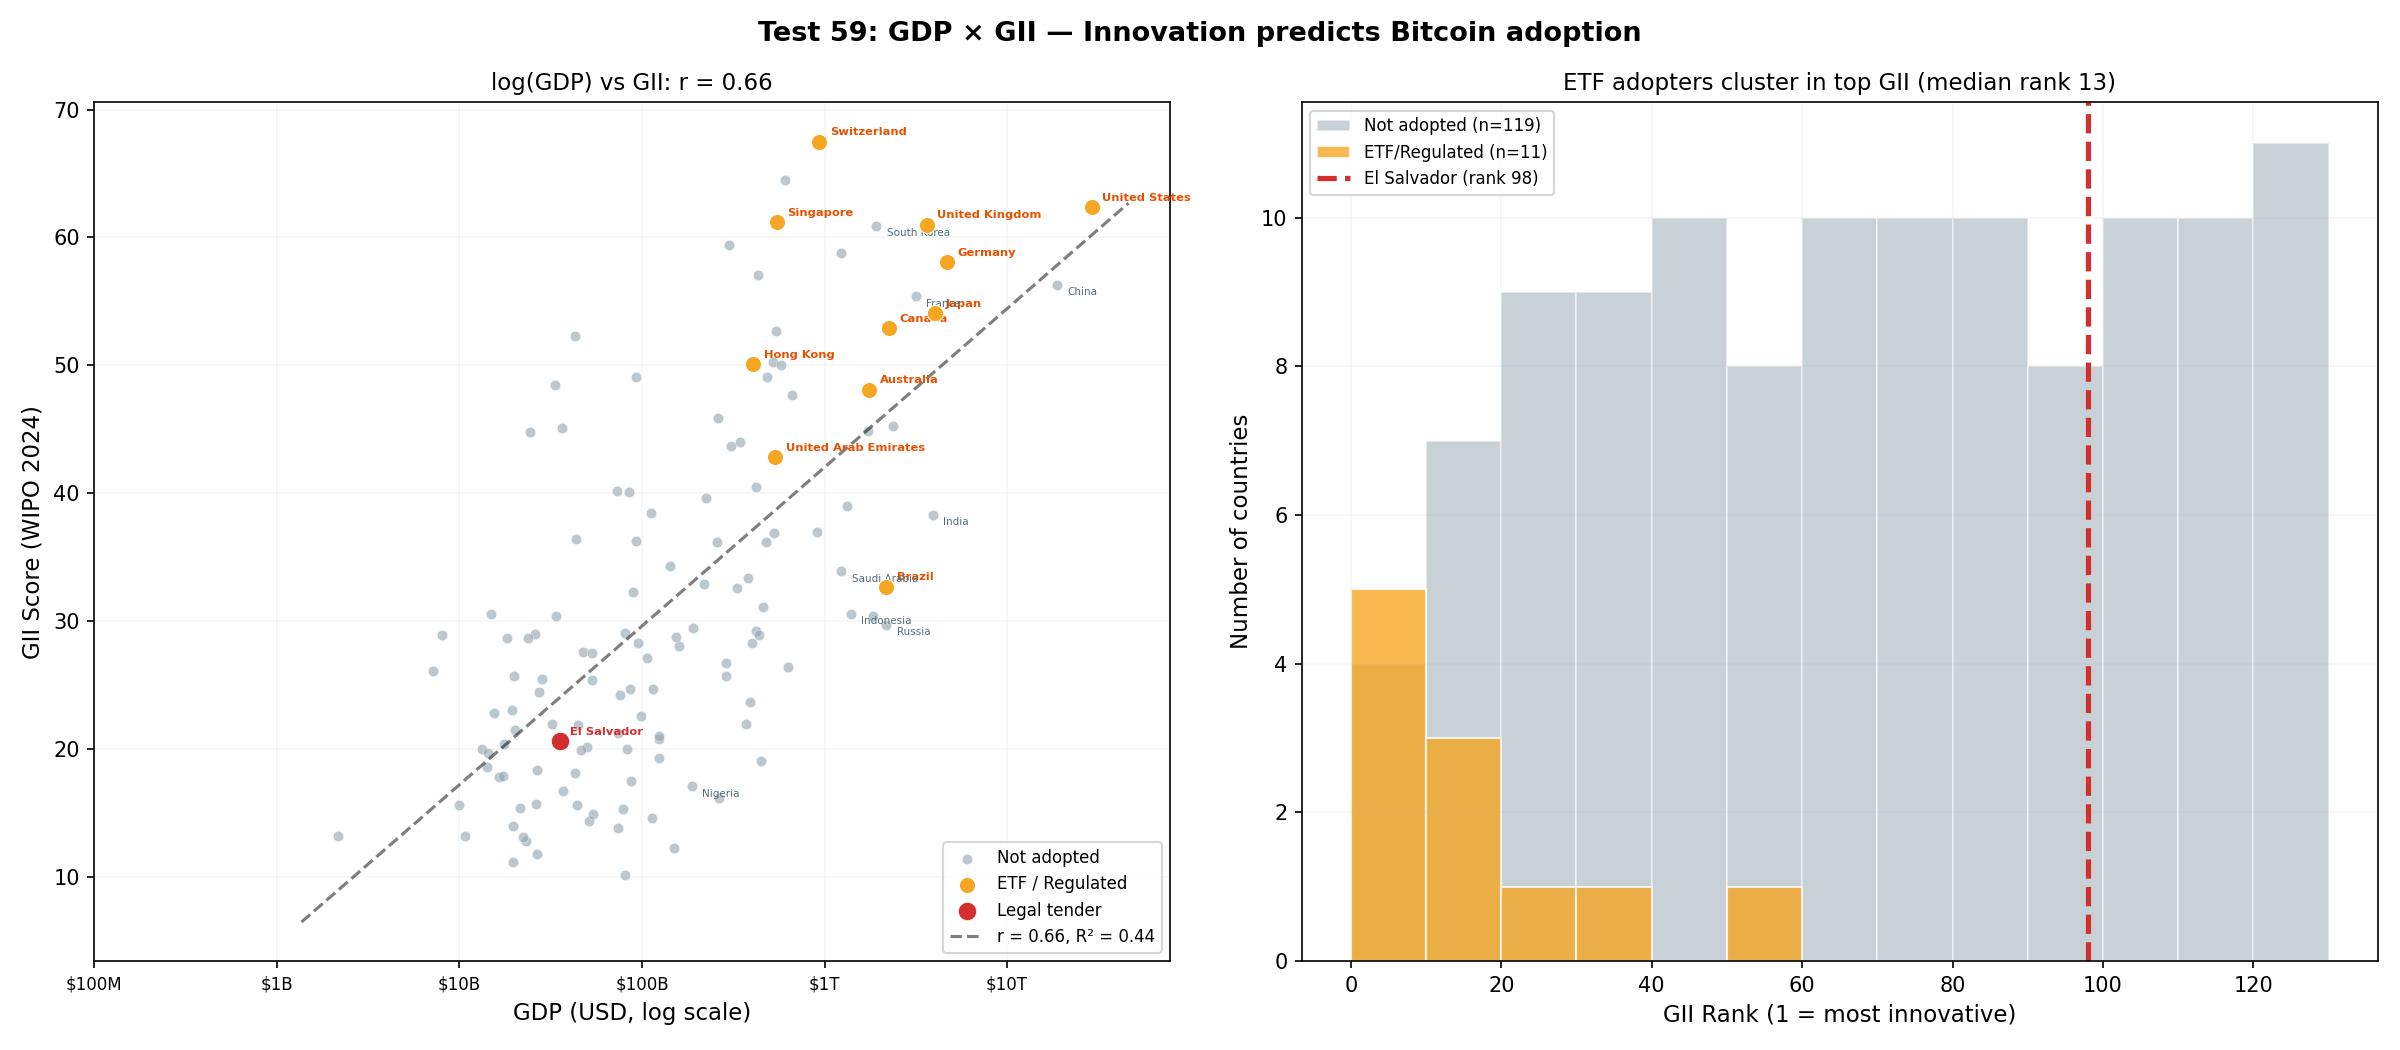
Test 59 ★ load-bearing
GDP vs GII
Institutional adopters cluster at the innovation frontier (median GII rank 13/133).
Size & ownership vs GII figure
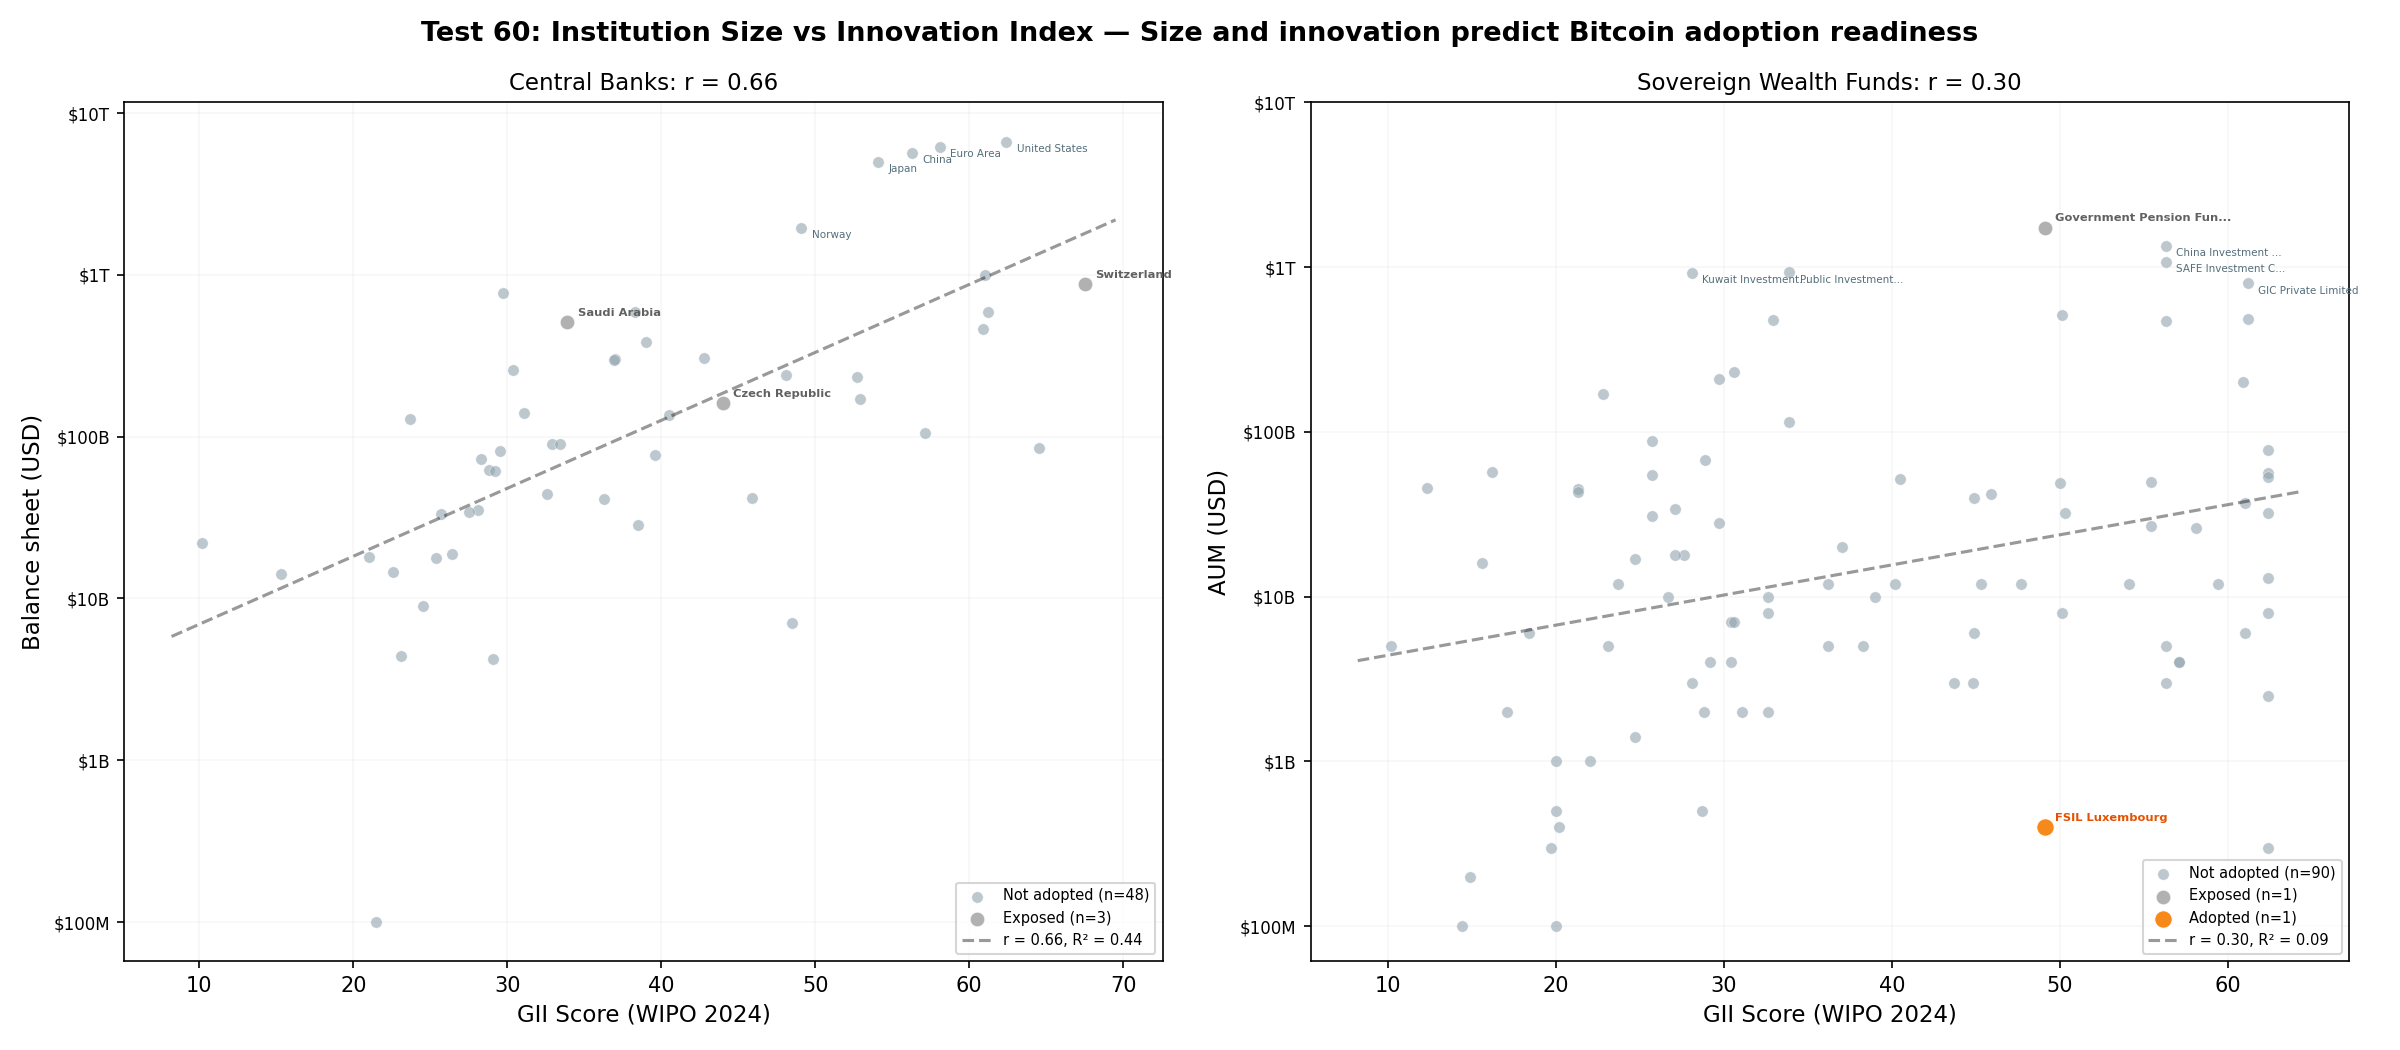
Test 60 ★ load-bearing
Size & ownership vs GII
Two adoption drivers: innovation and monetary necessity.
HODL waves figure
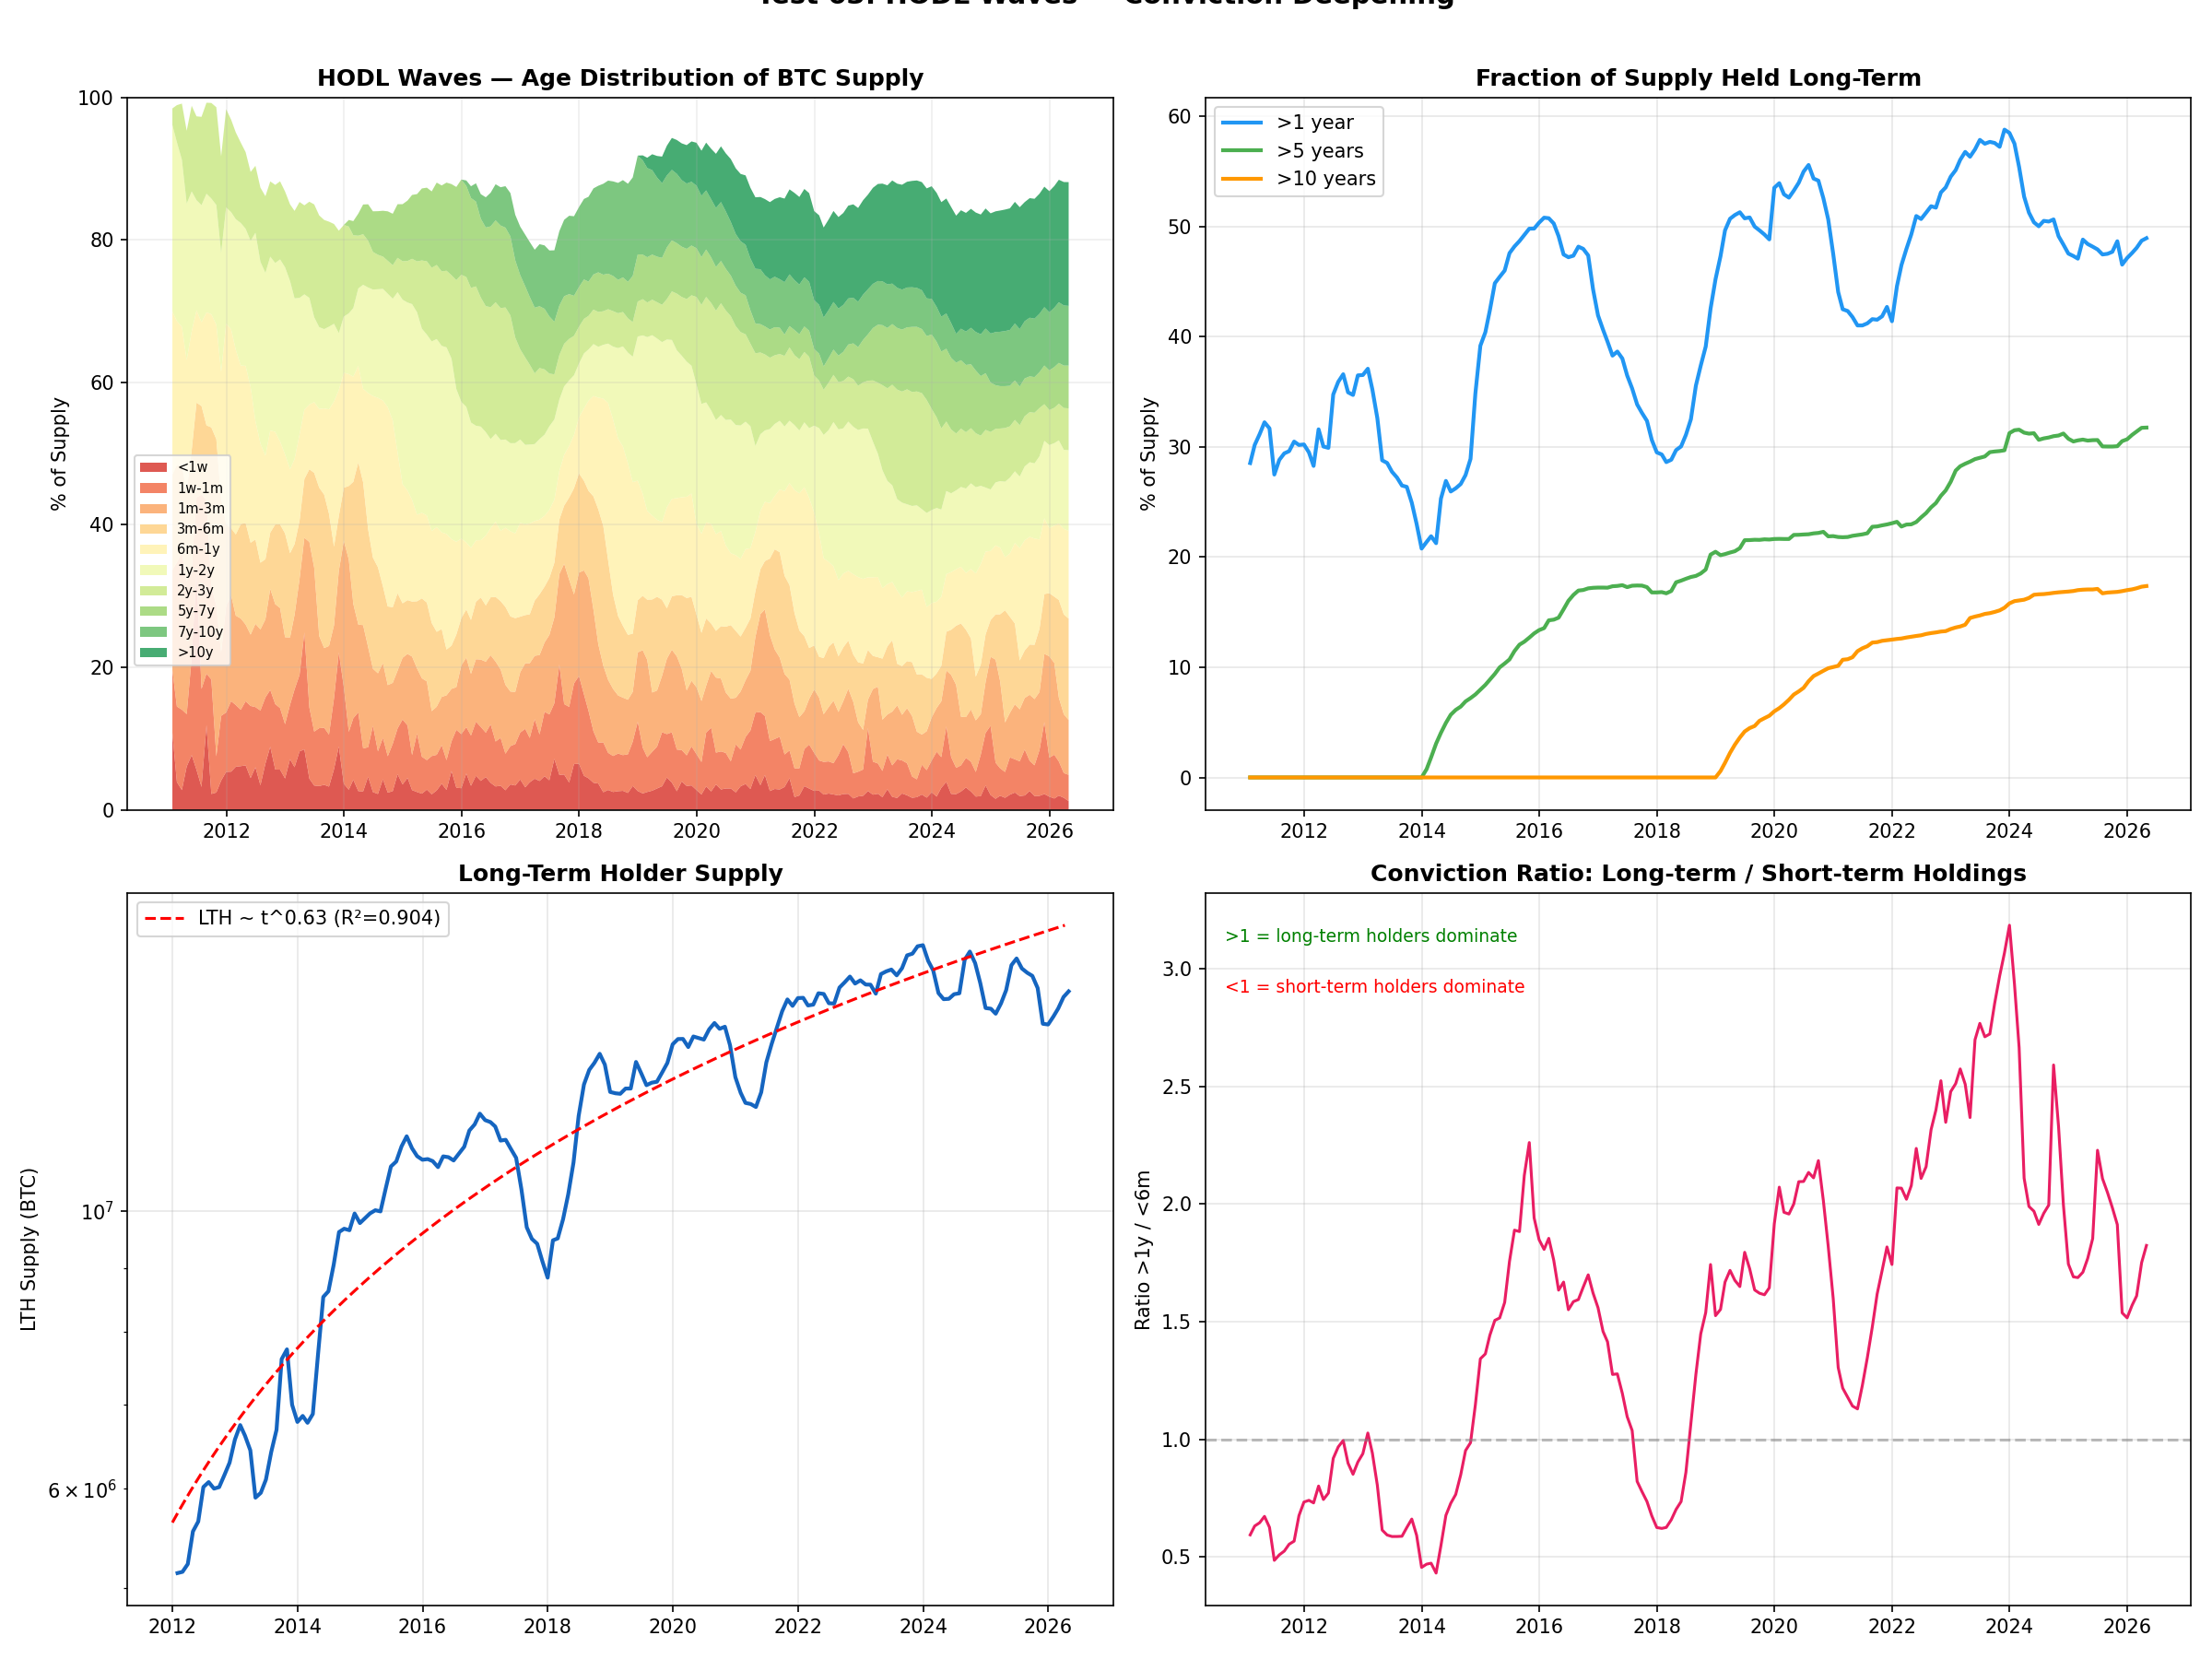
Test 63 corroborative
HODL waves
49% of supply held >1y; long-term holdings grow as t^0.63.

The wealth Pareto (alpha ~ 1.2)

Pareto predicts gamma figure
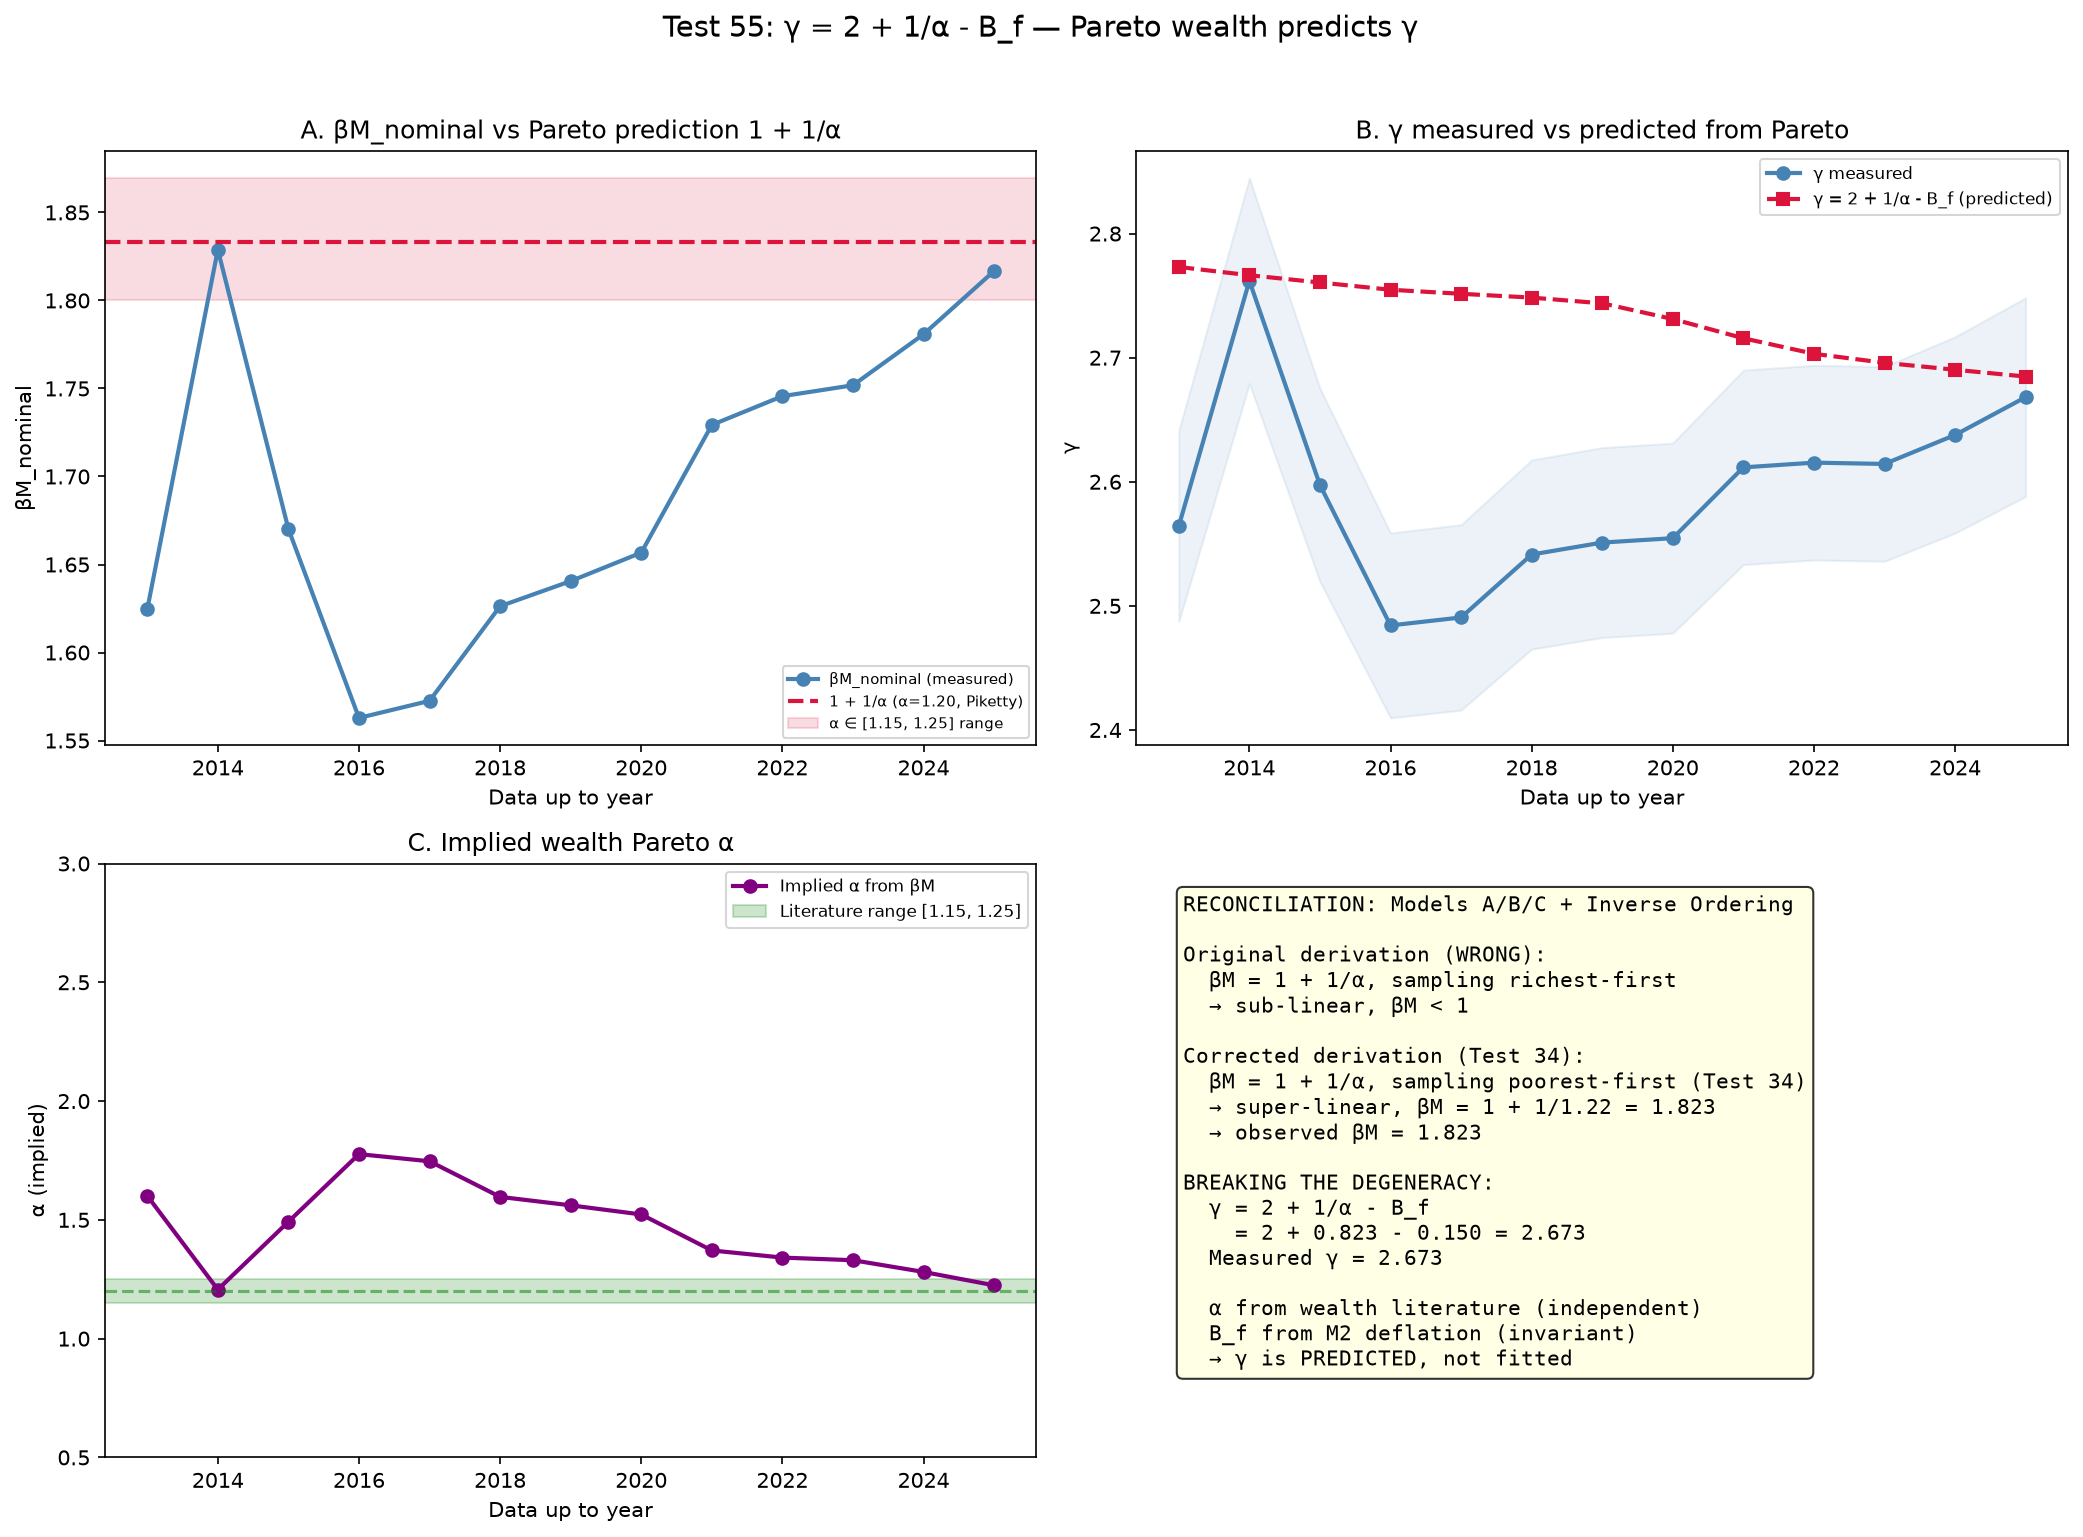
Test 55 ★ load-bearing
Pareto predicts gamma
alpha = 1.22 from the wealth literature predicts the exponent, no free parameter.
Pareto by stratum figure
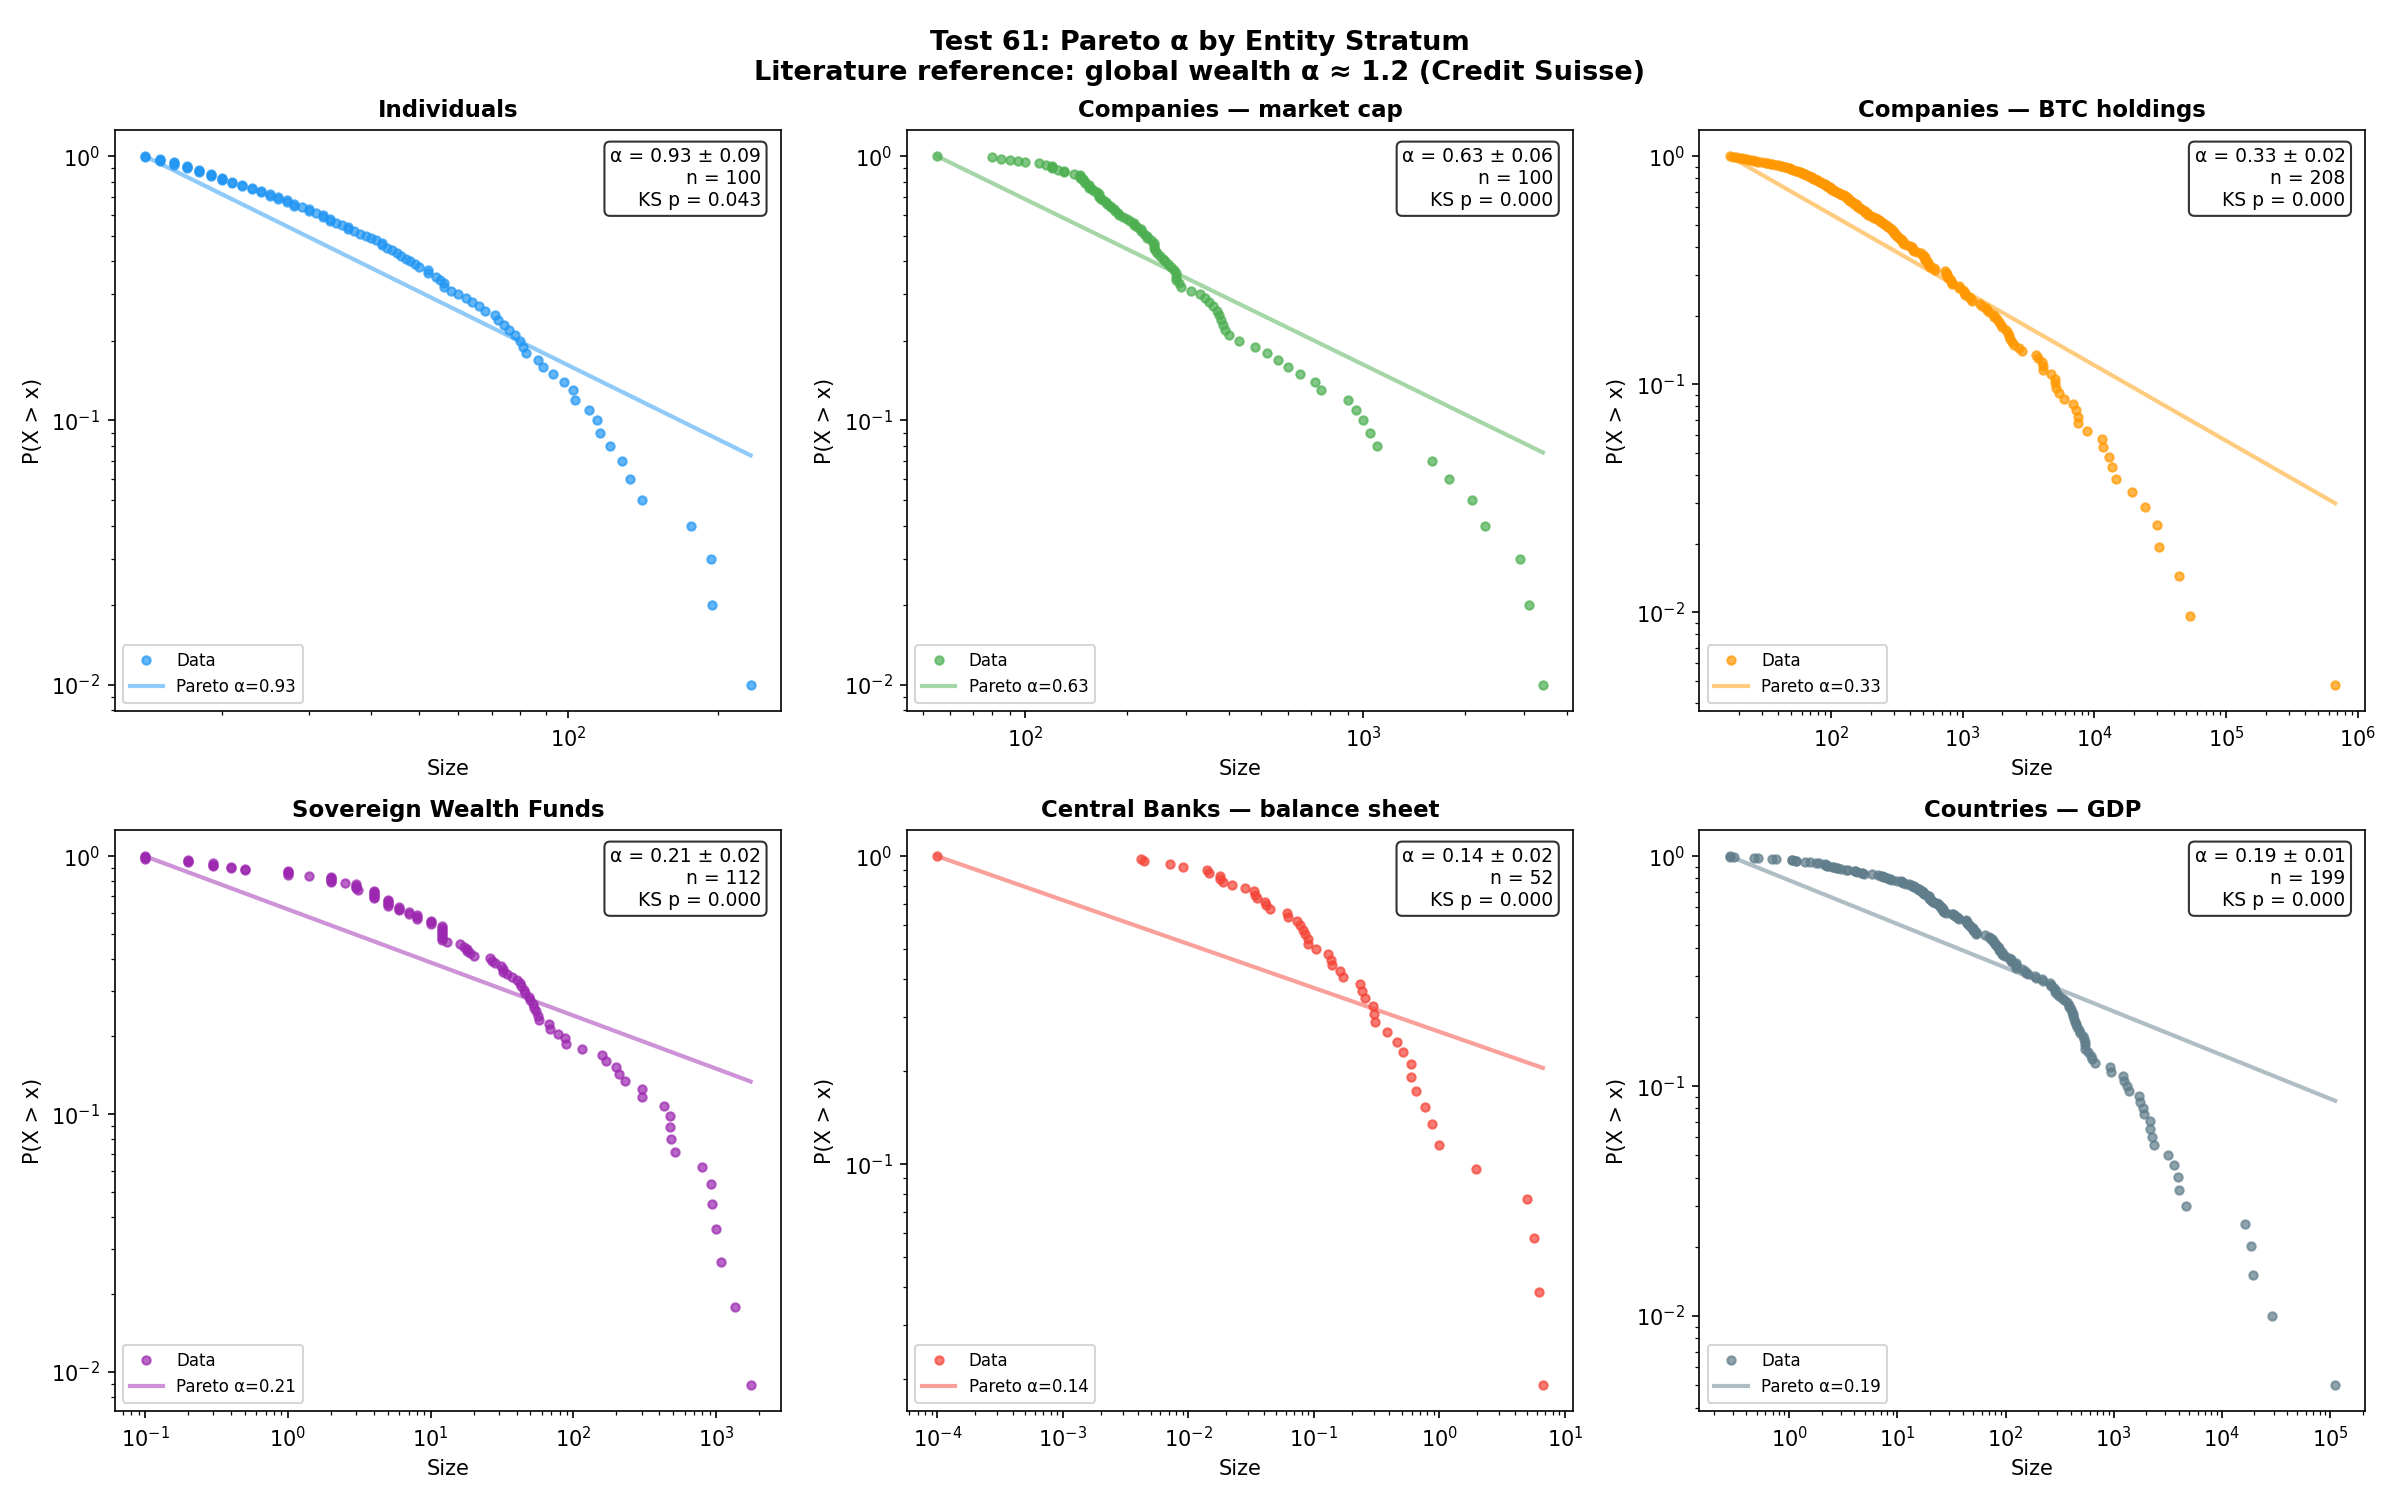
Test 61 corroborative
Pareto by stratum
Sampling bias dominates; individuals converge to alpha ~ 1.25.
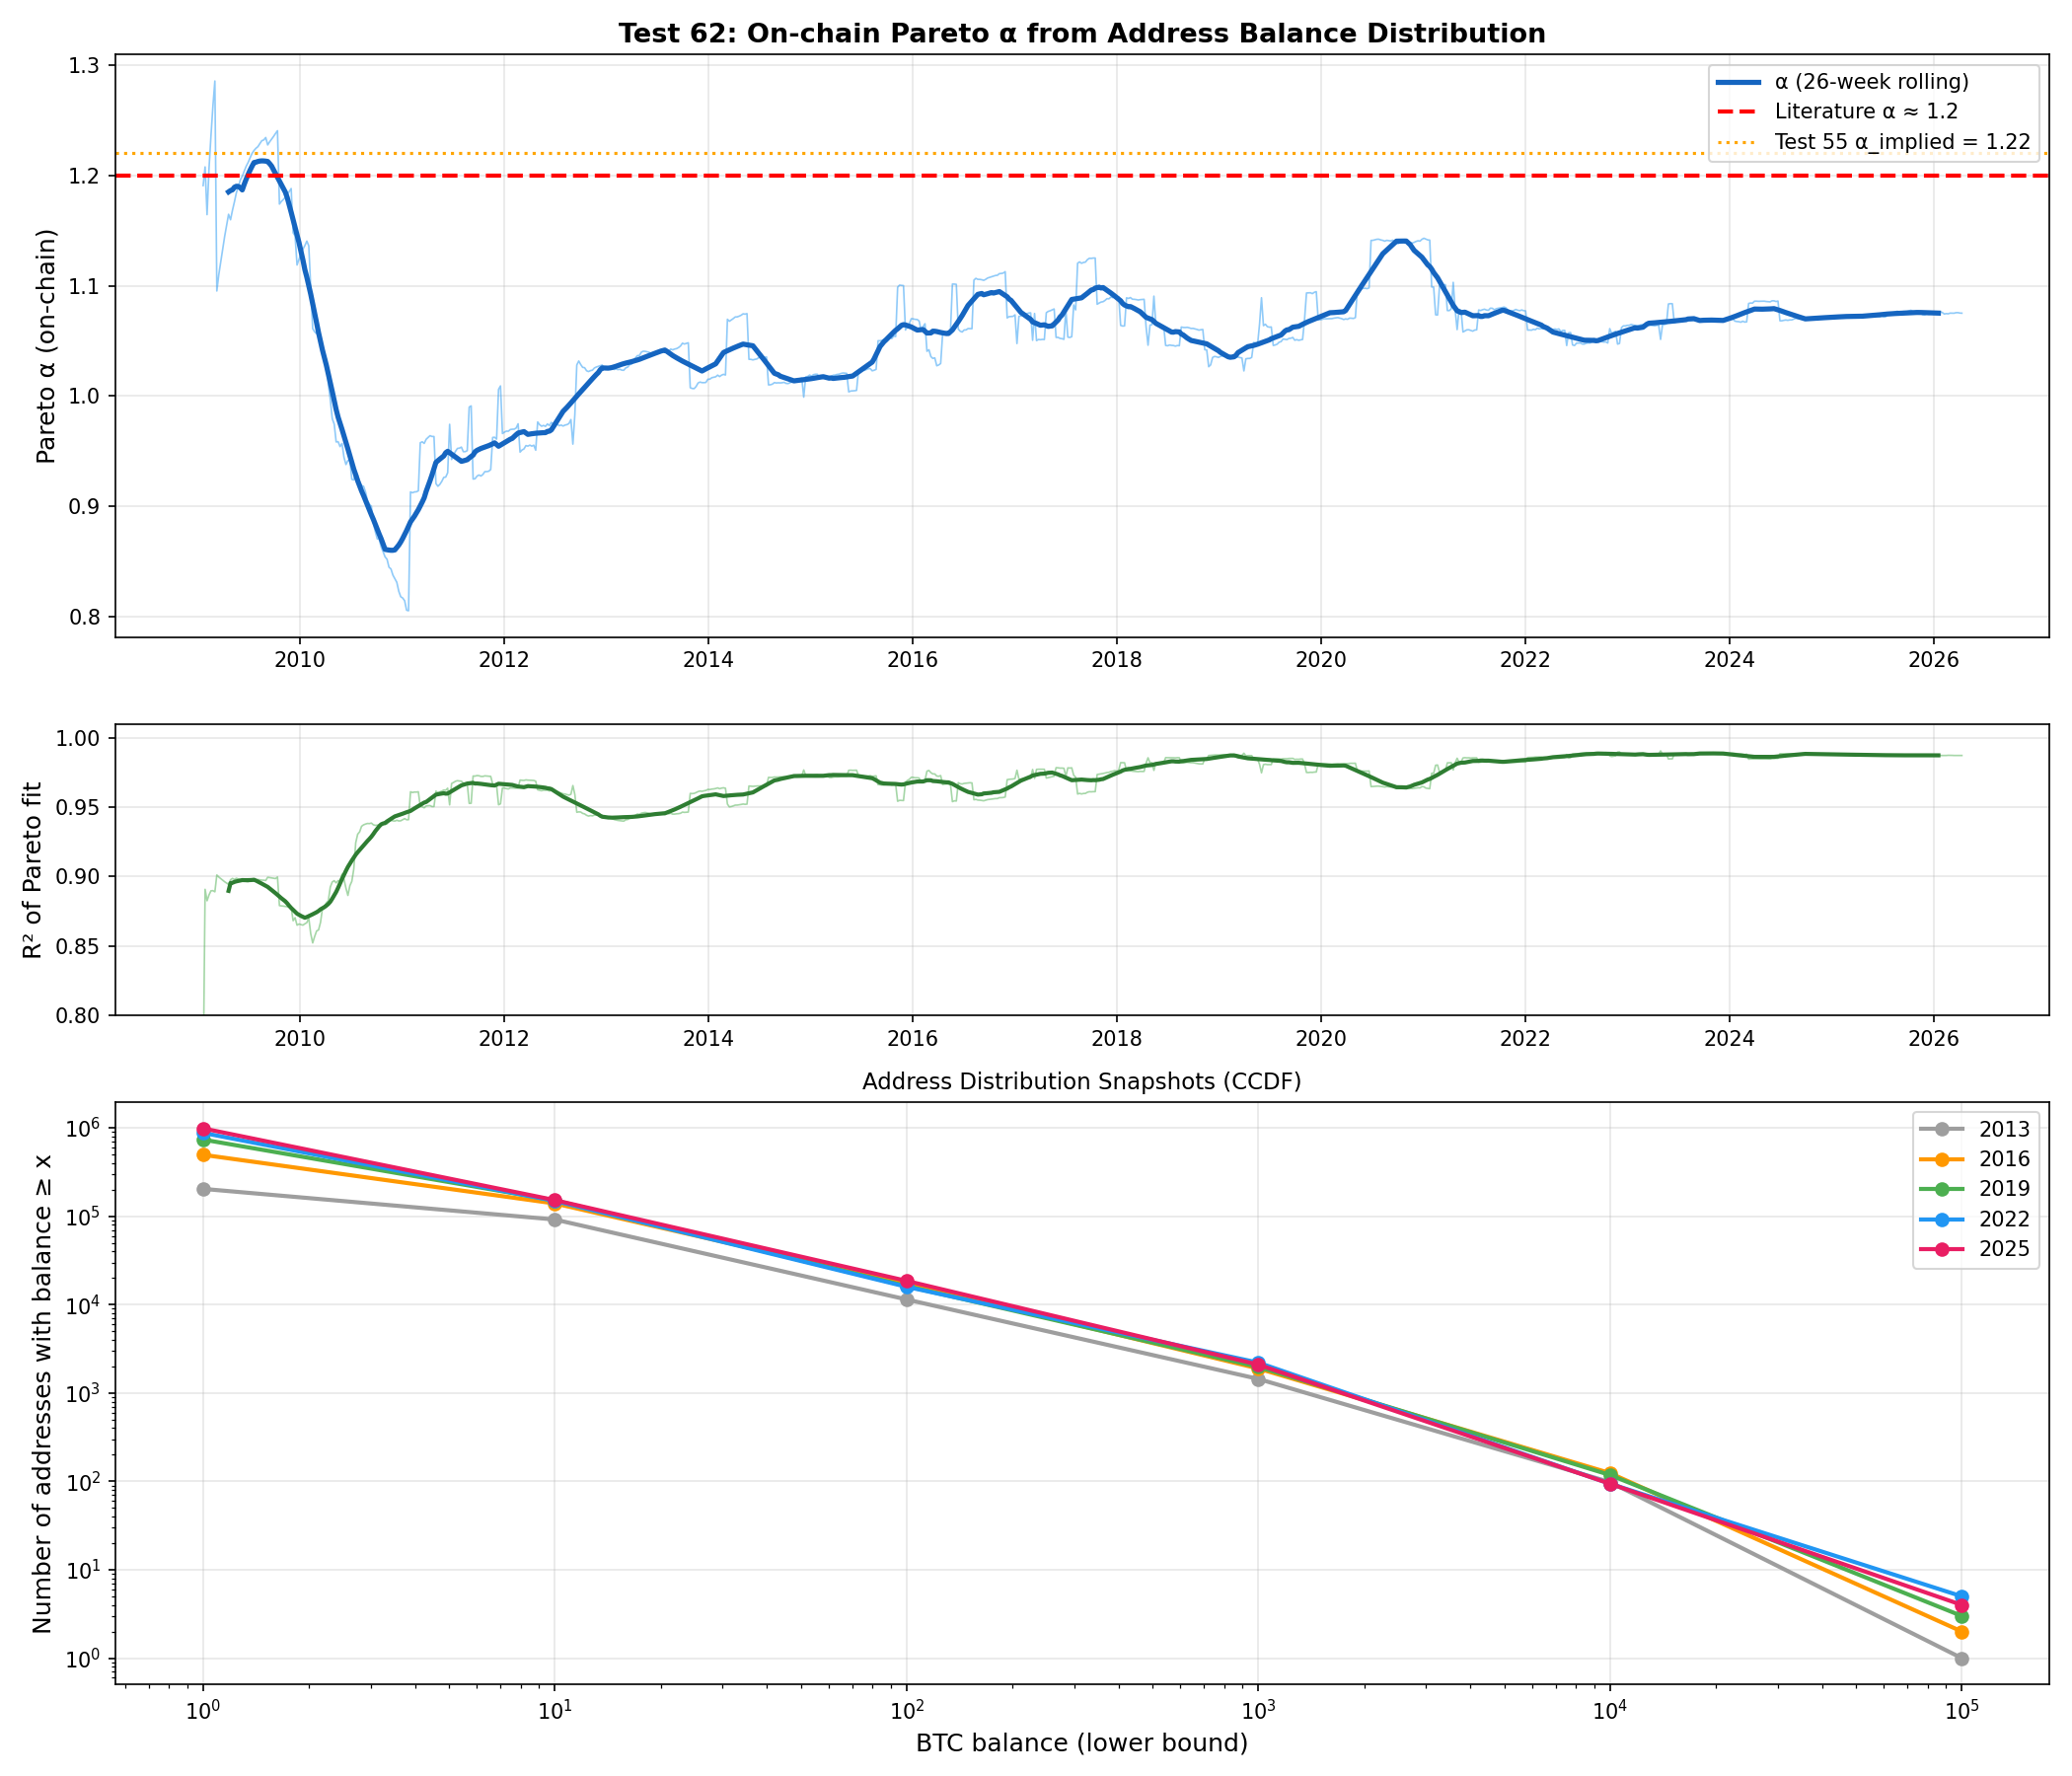
On-chain Pareto figure
Test 62 ★ load-bearing
On-chain Pareto
BTC wealth is a clean Pareto, alpha ~ 1.07 - a different quantity than fiat alpha.
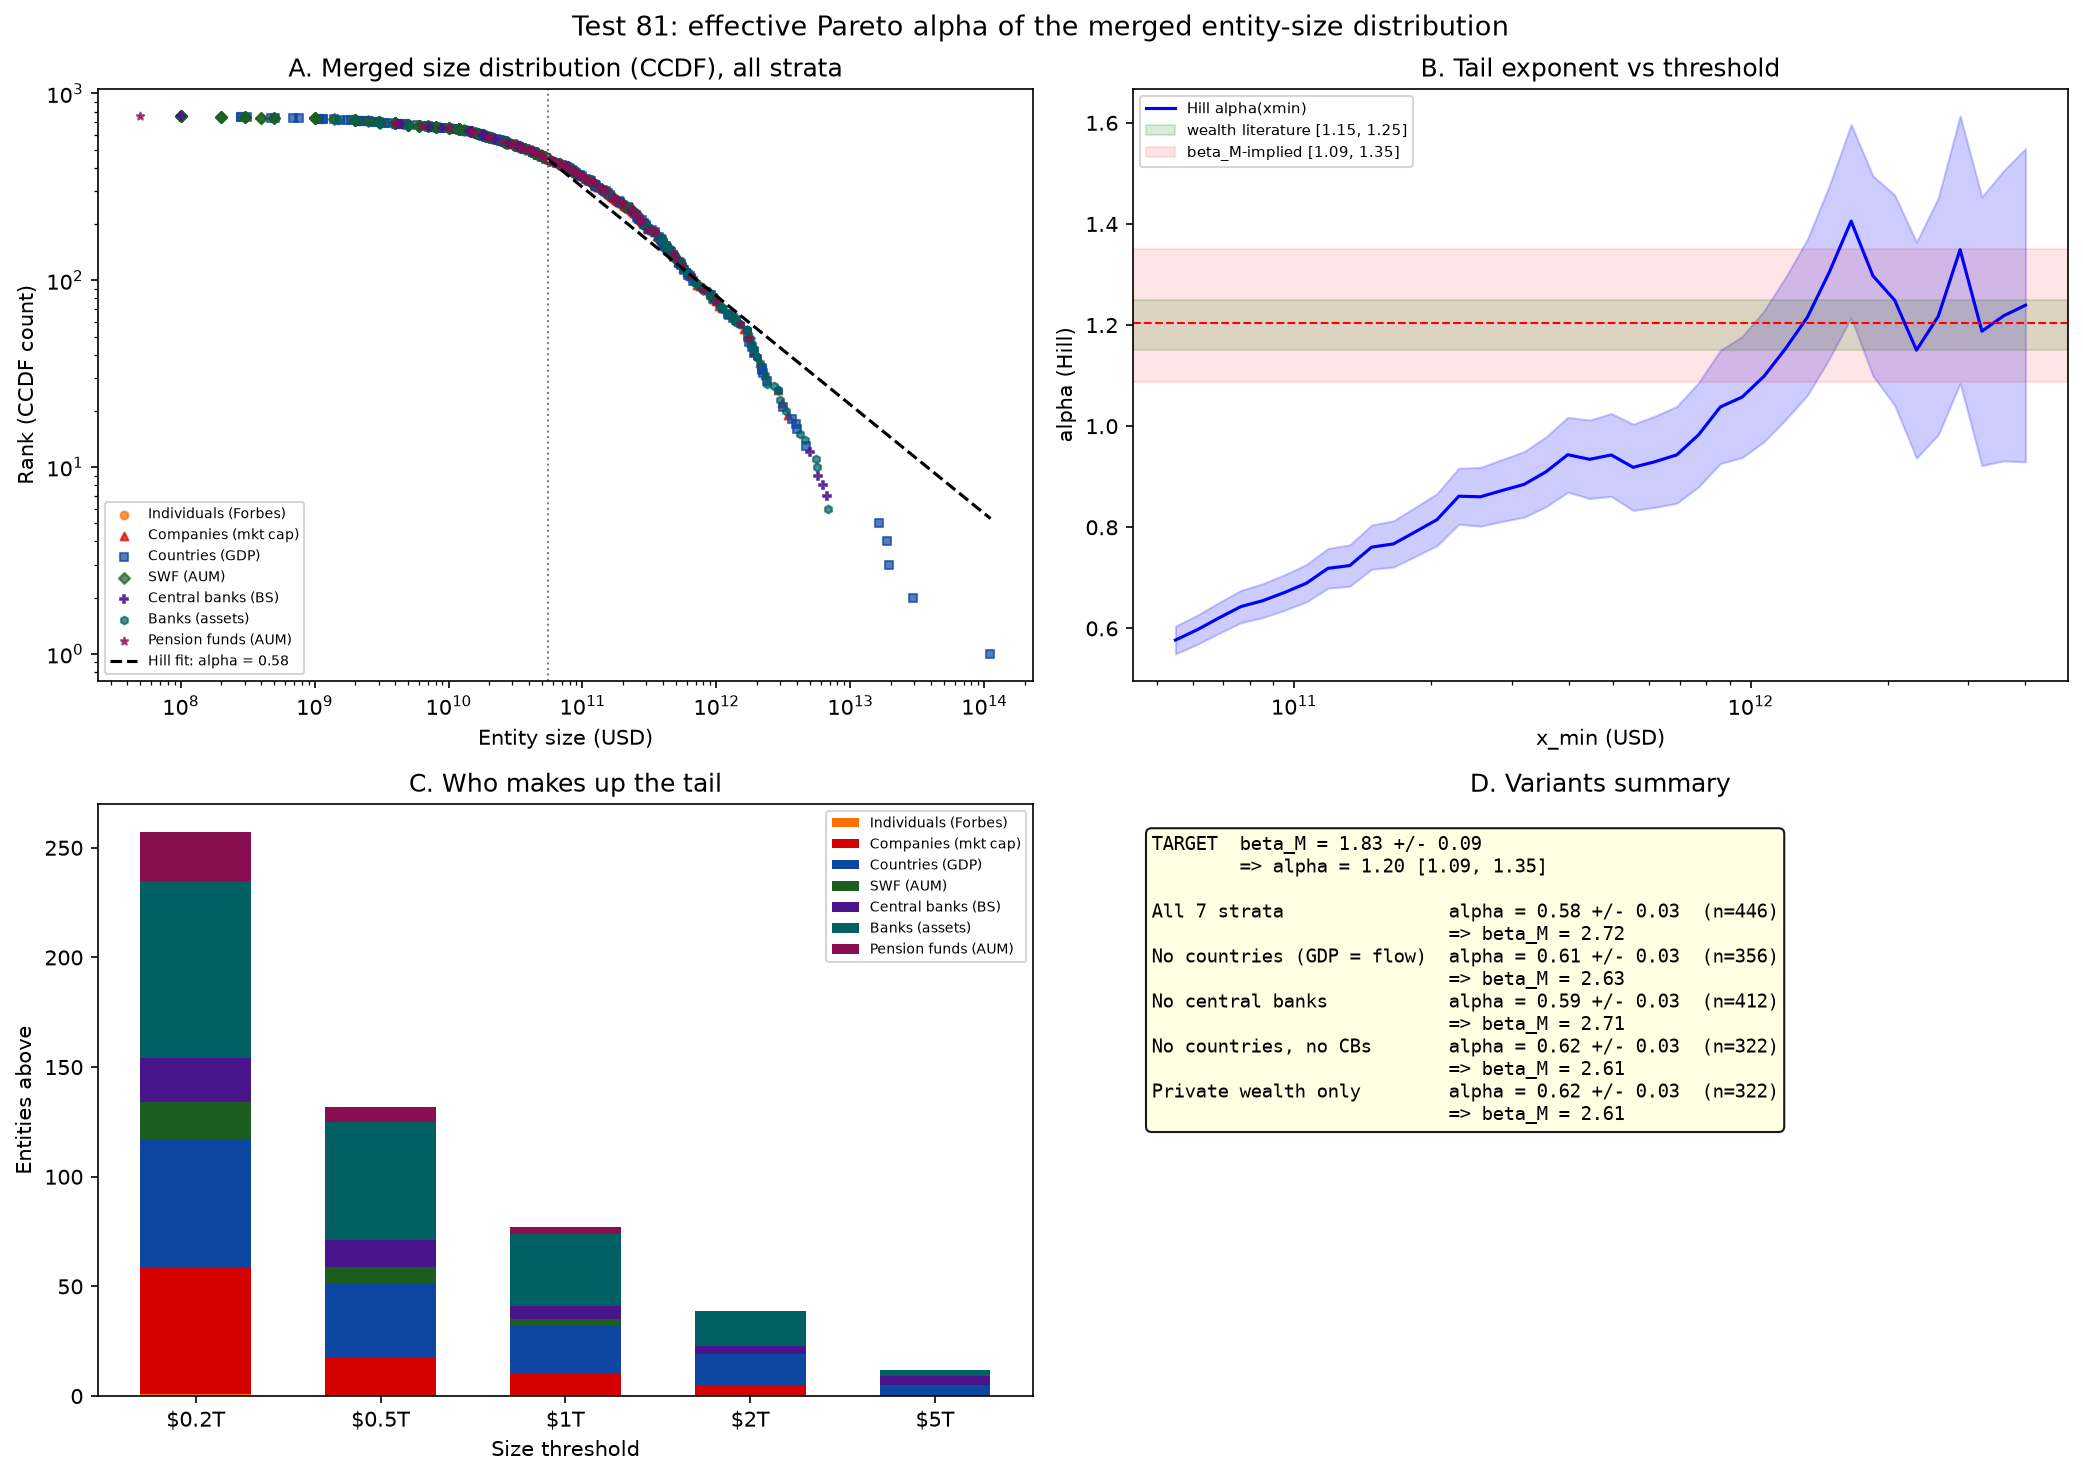
Merged-strata alpha figure
Test 81 corroborative
Merged-strata alpha
The merged entity-size distribution is not a single Pareto; the naive 1+1/alpha identity fails.

On-chain cross-checks

Daily narrative figure
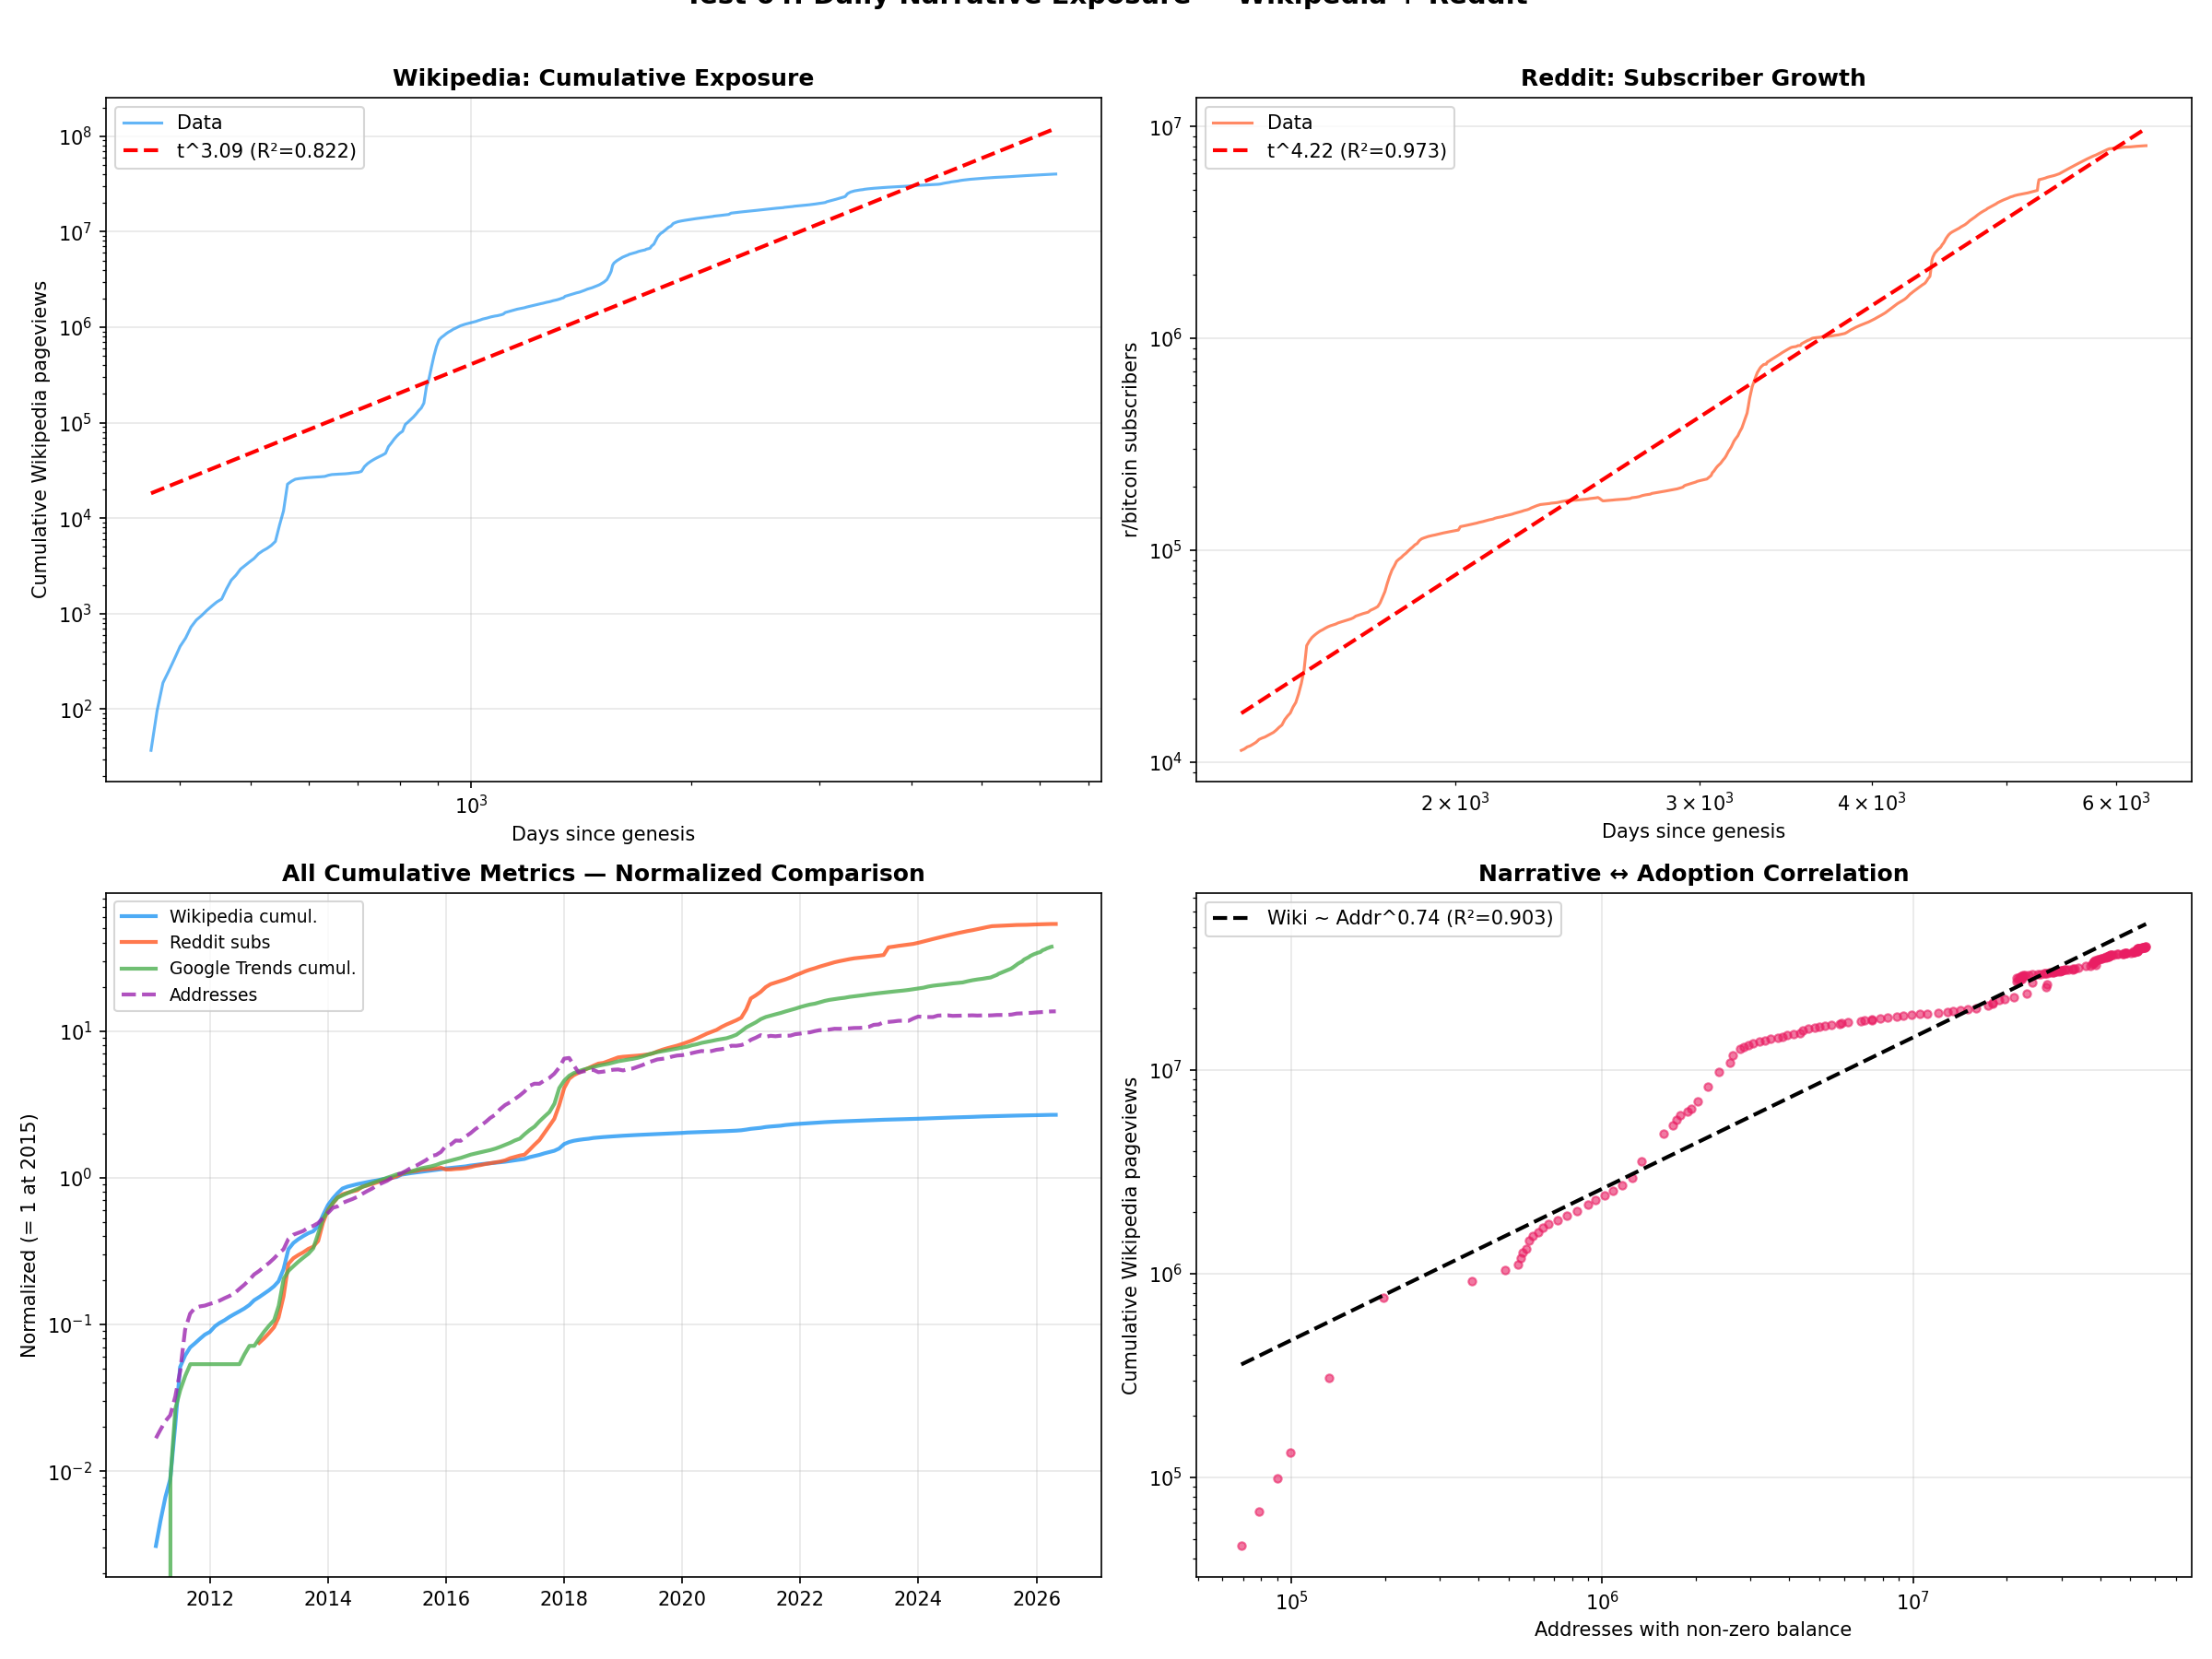
Test 64 ★ load-bearing
Daily narrative
Wikipedia cumulative pageviews ~ t^3.09 - third independent t³.
Hot/cold supply figure
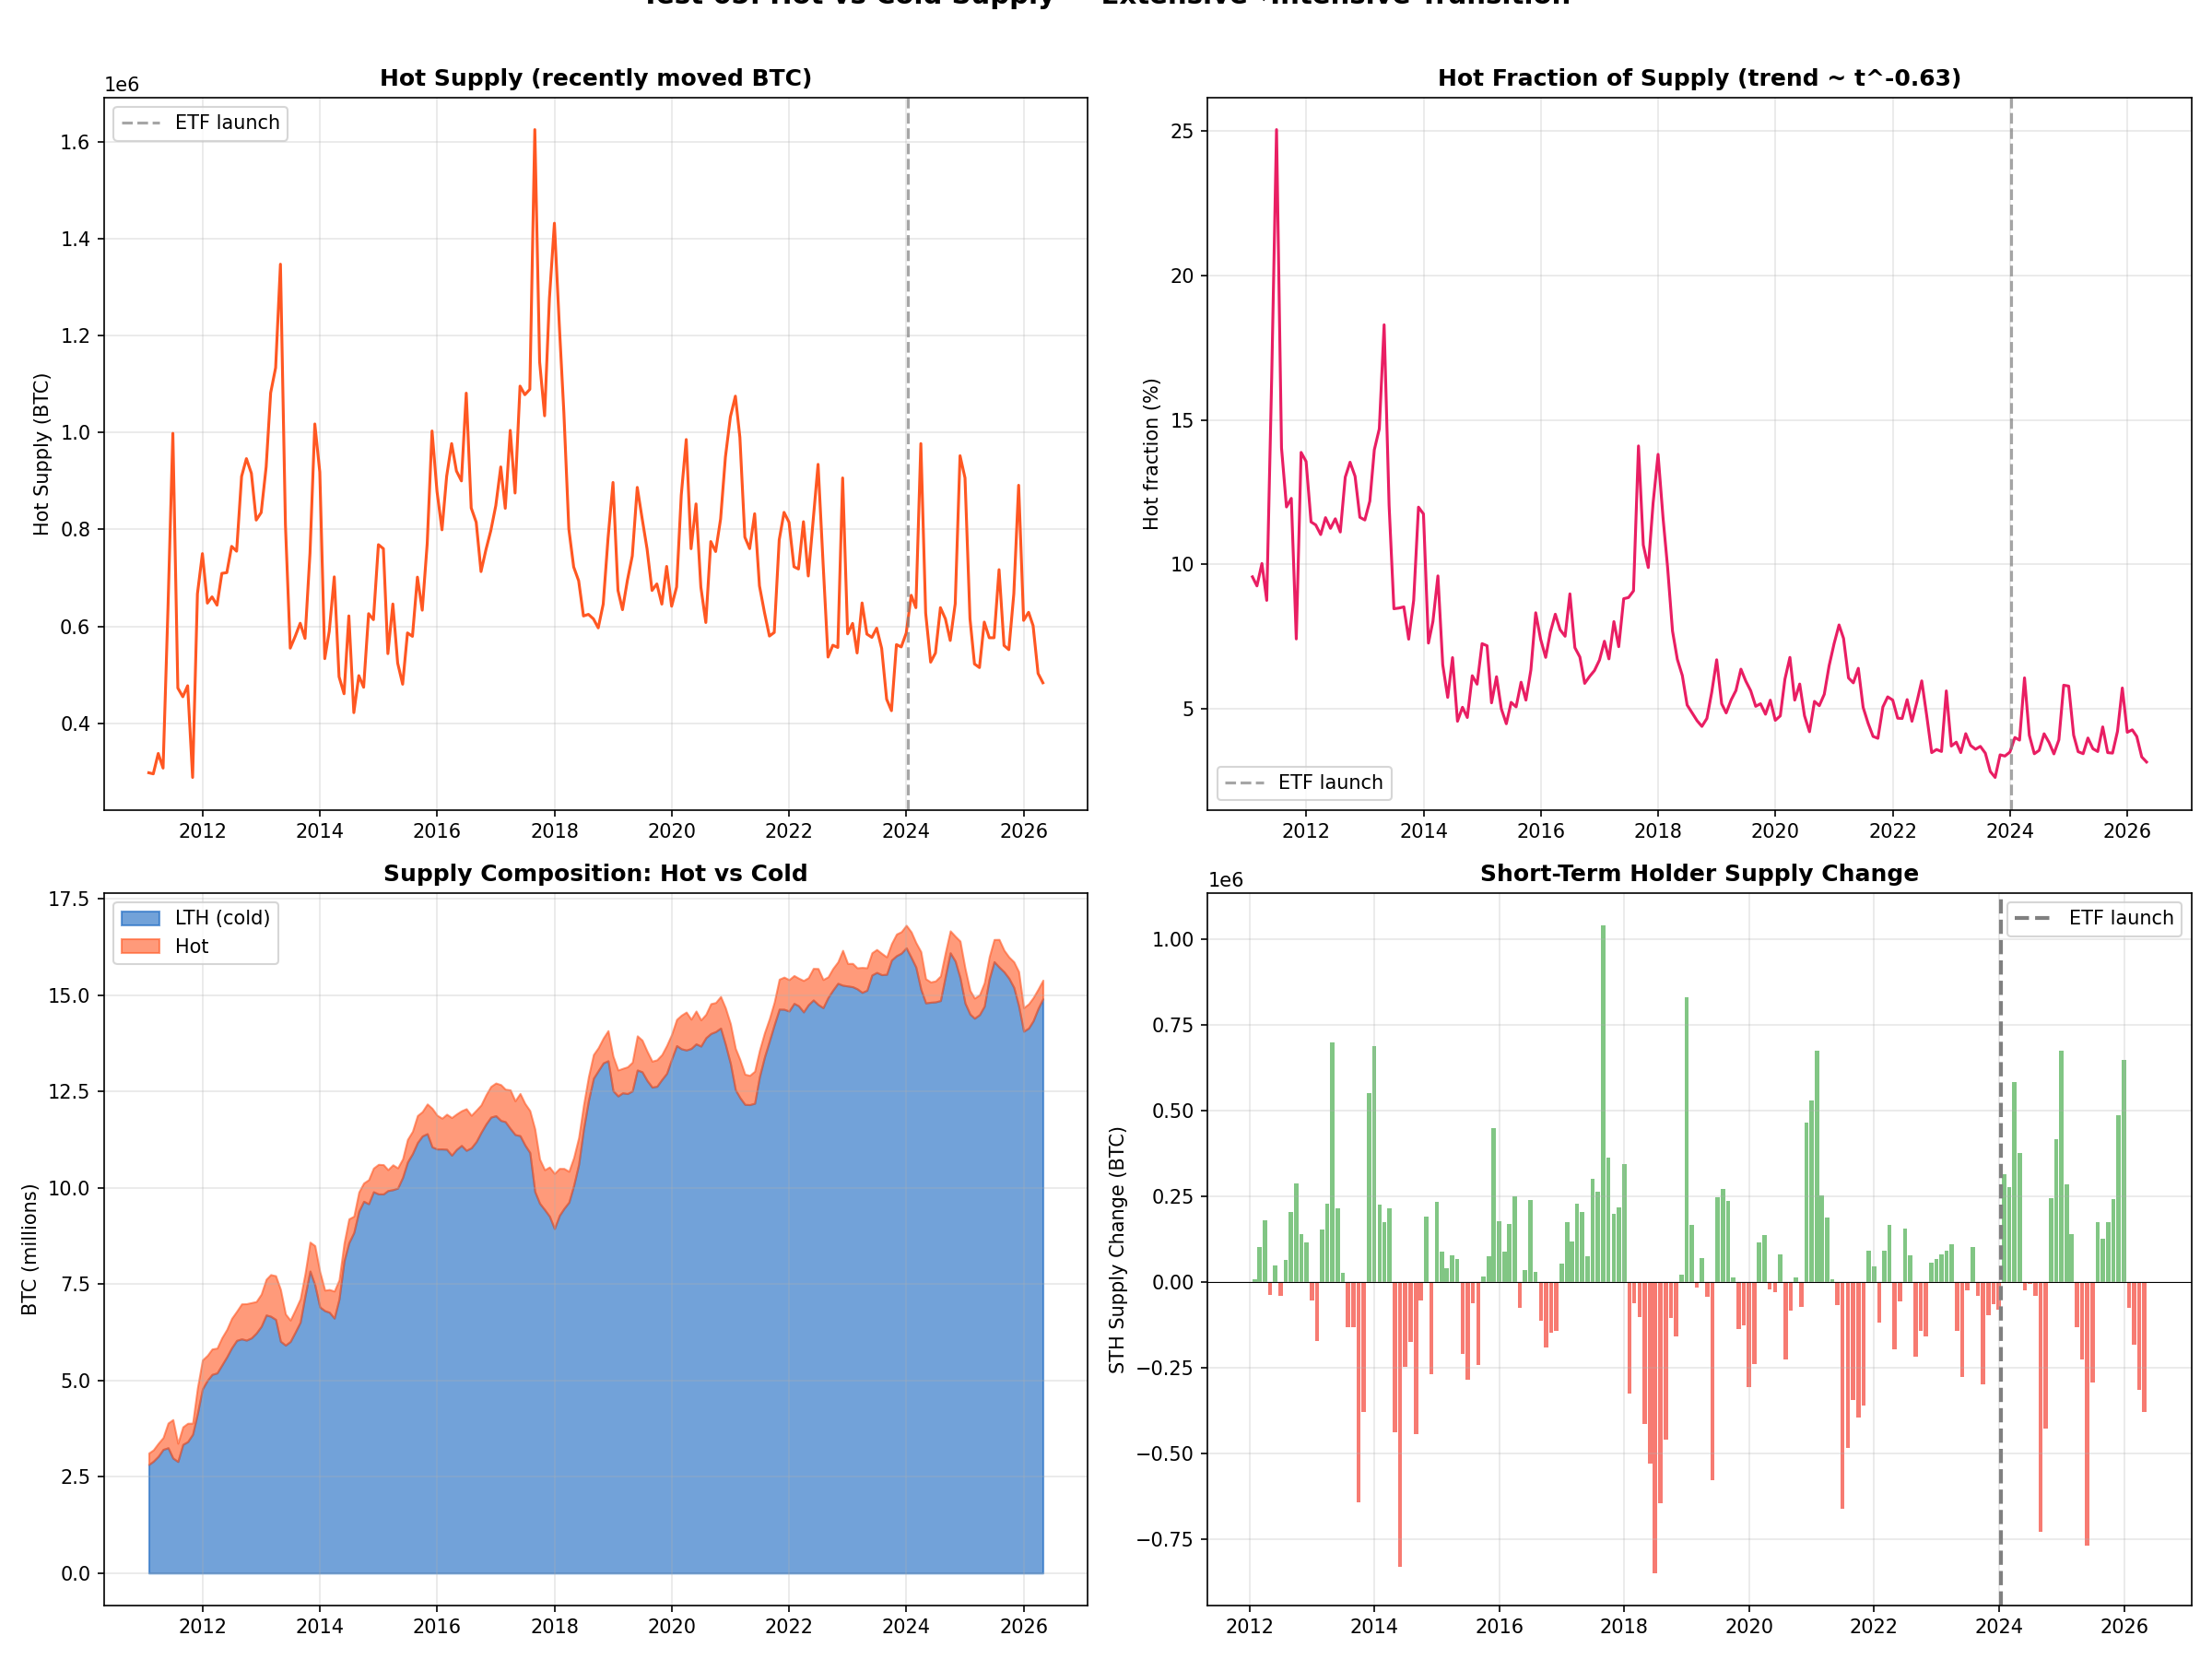
Test 65 corroborative
Hot/cold supply
The actively-moving fraction declines as t^-0.63.
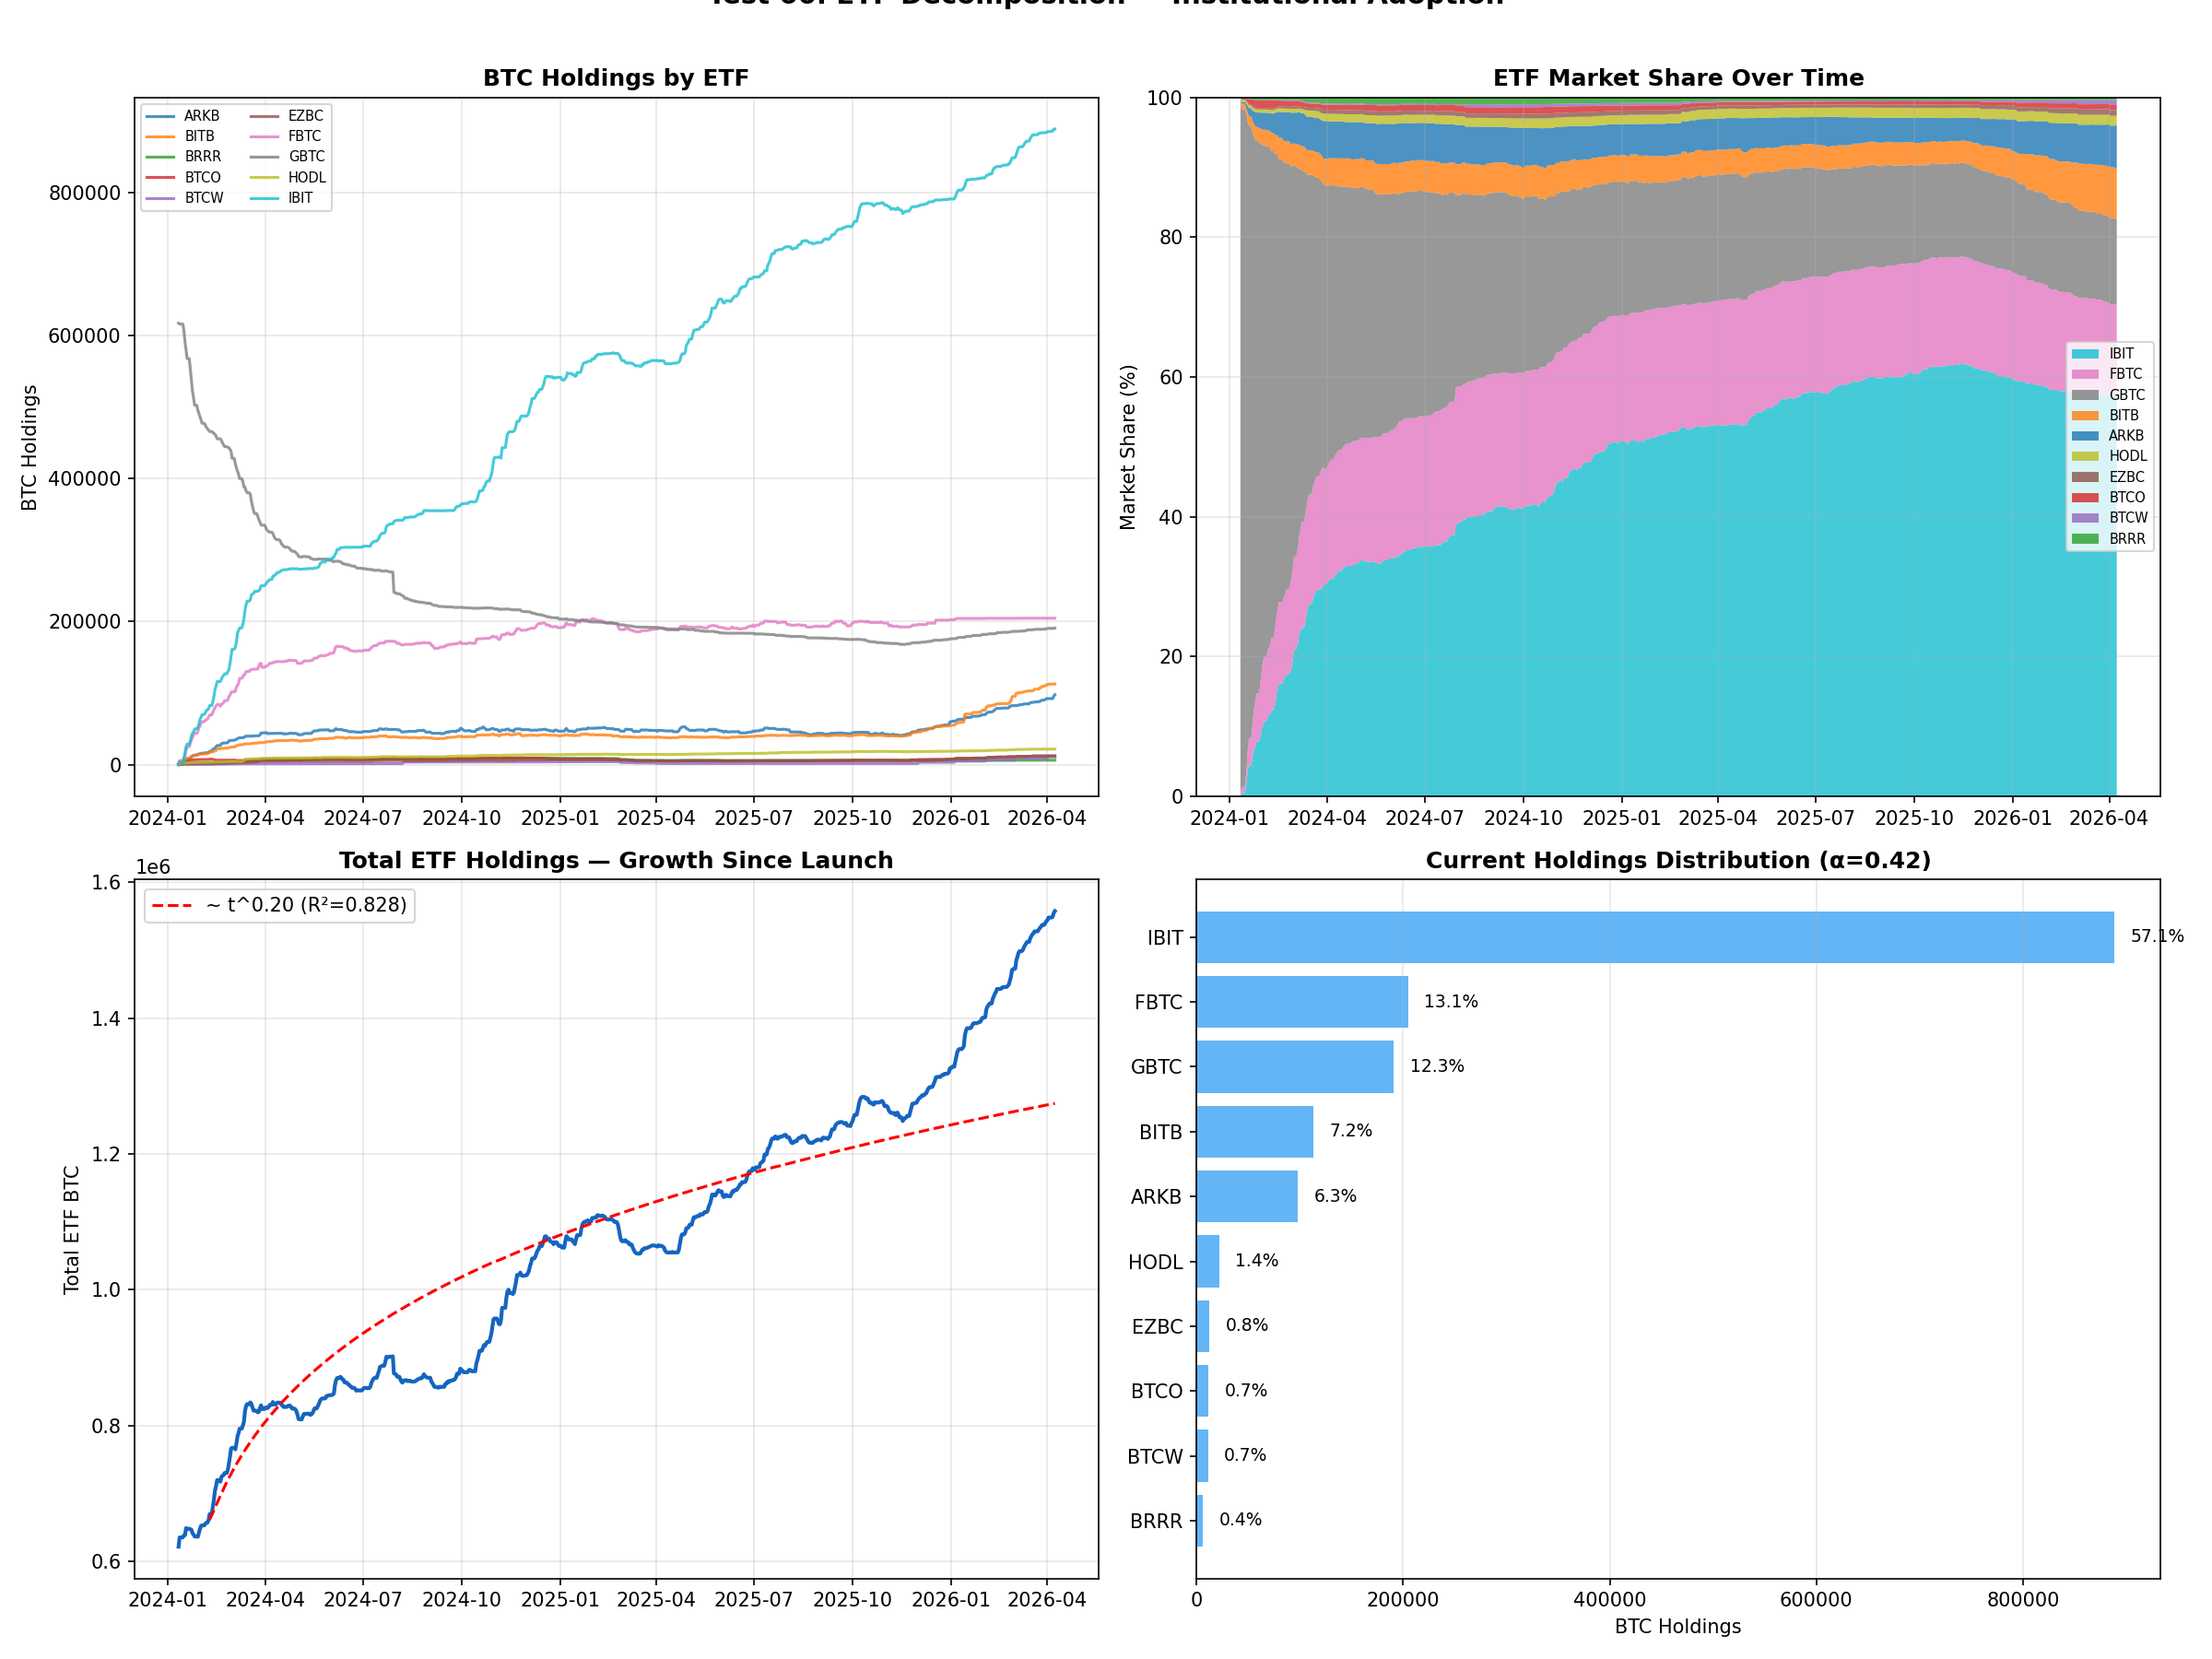
ETF decomposition figure
Test 66 corroborative
ETF decomposition
IBIT is 57% of ETF BTC (alpha = 0.42, most concentrated stratum).
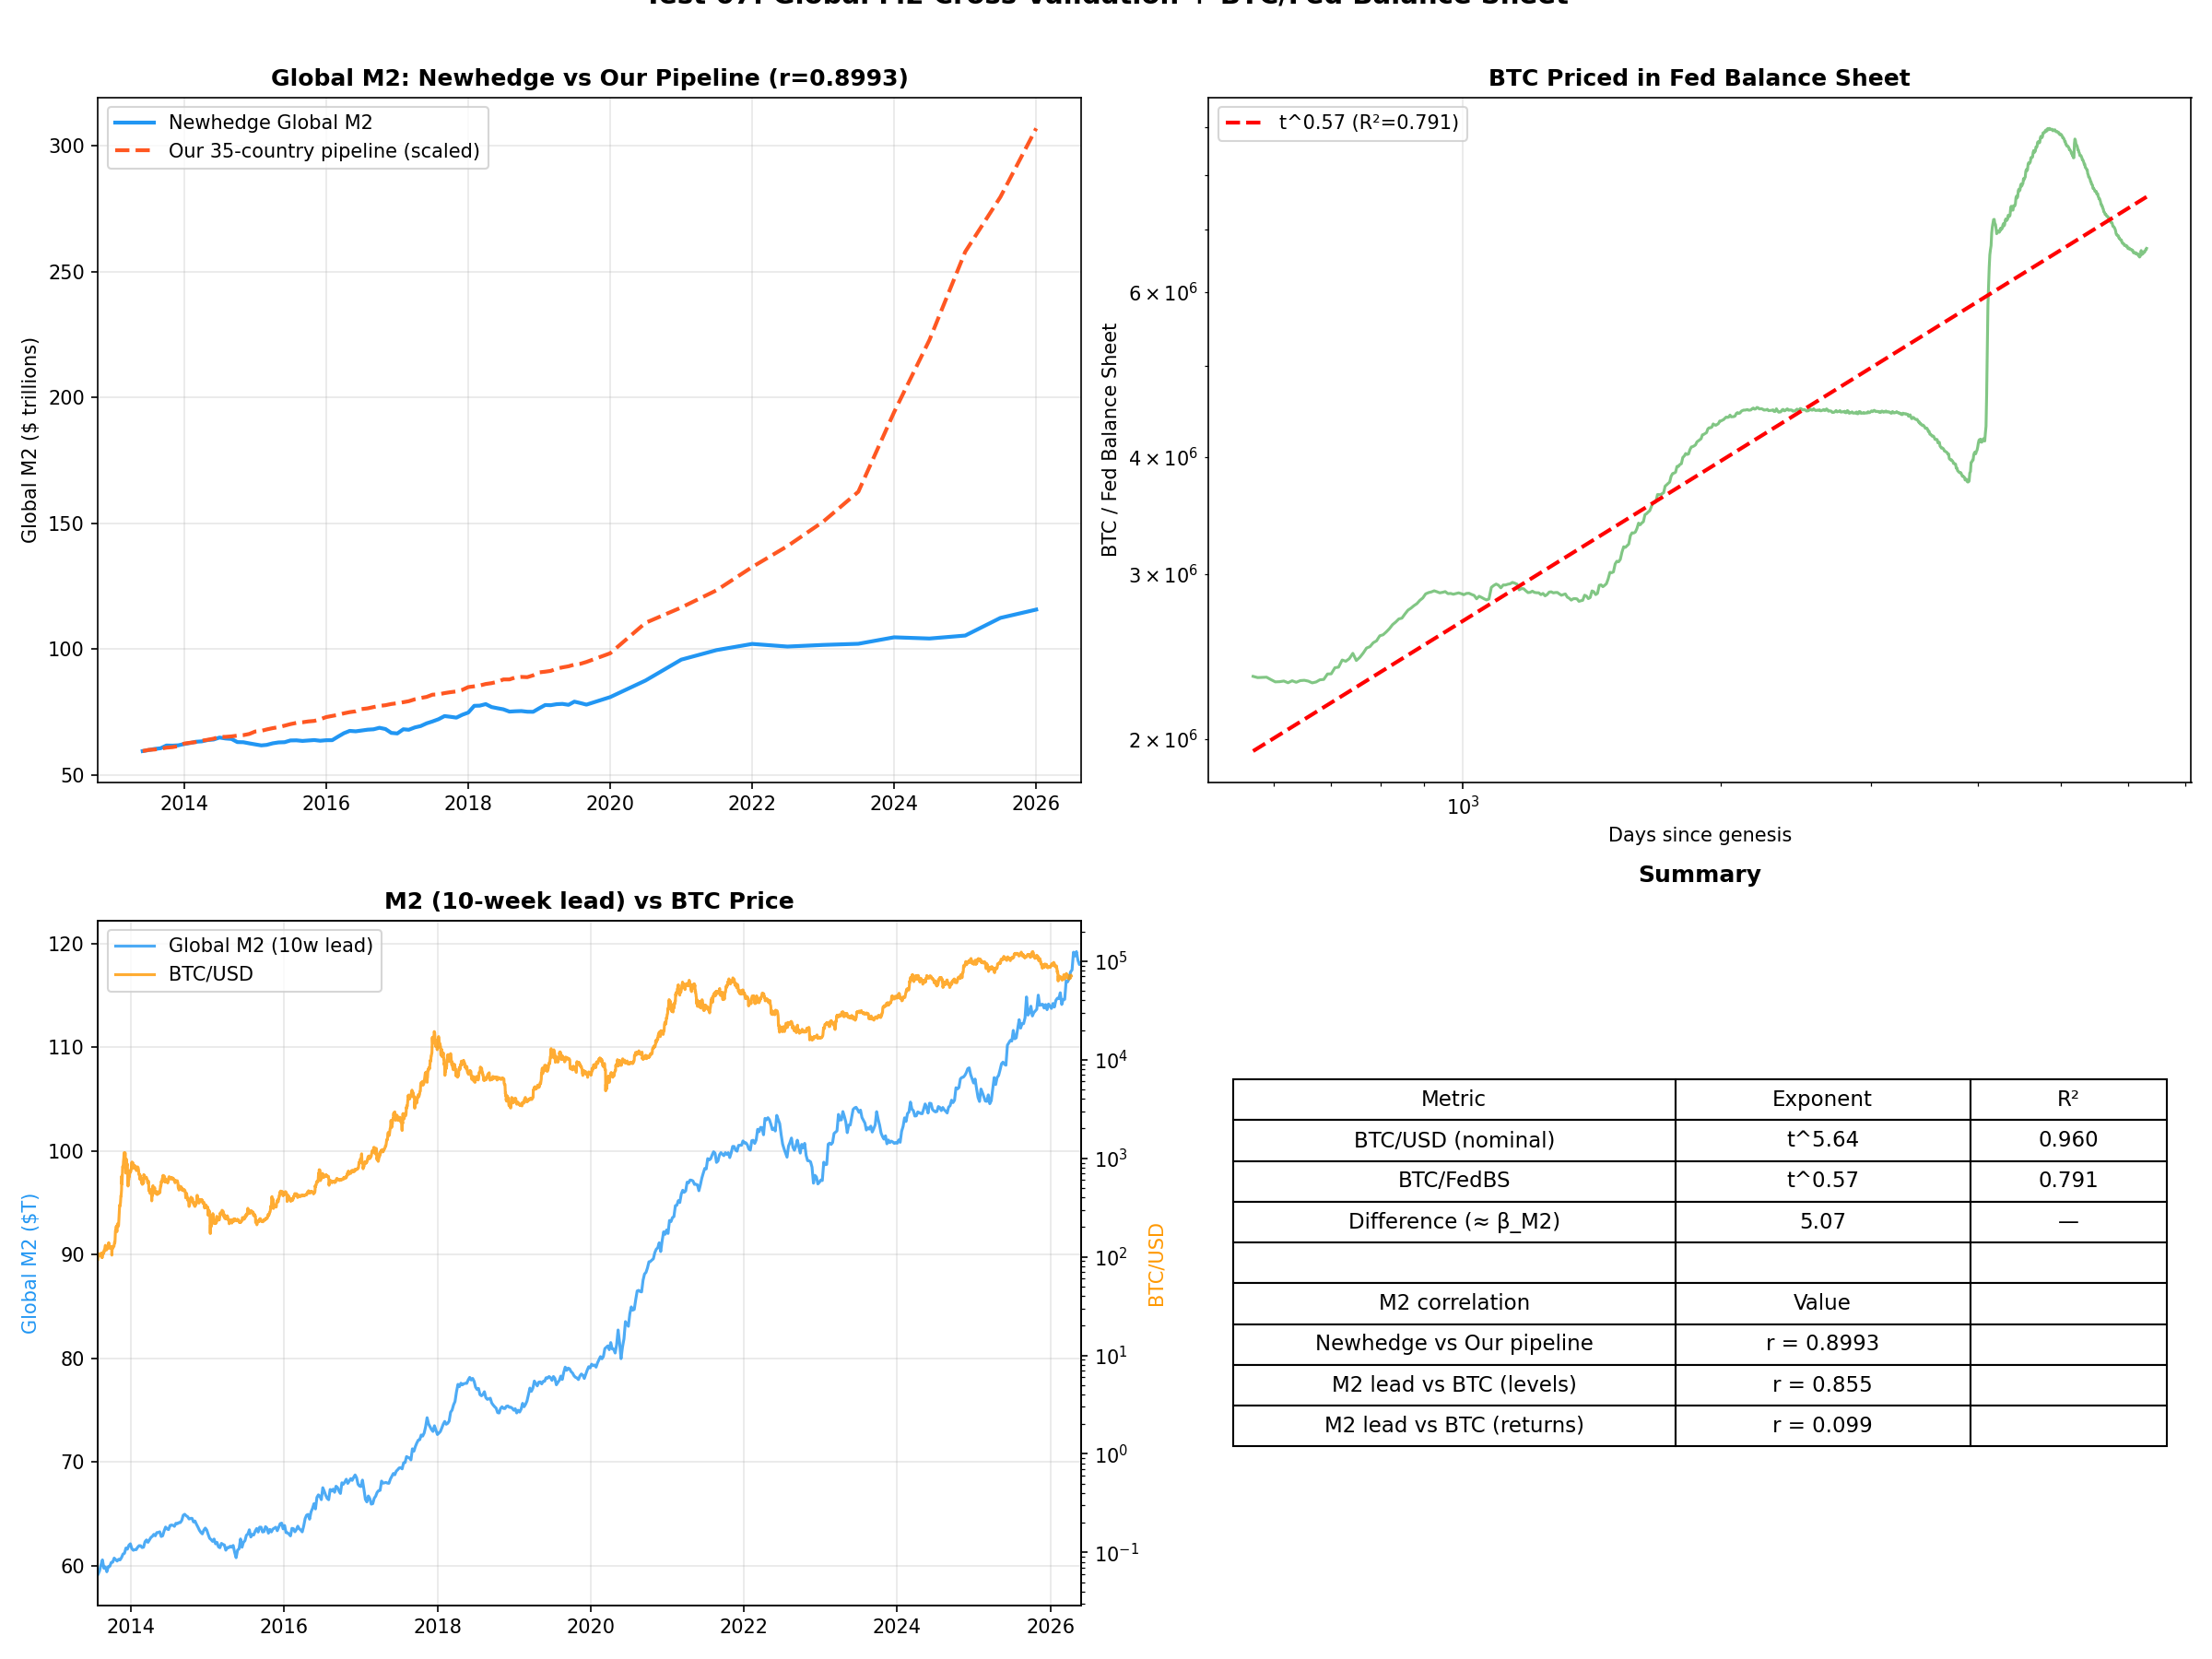
M2 cross-validation figure
Test 67 corroborative
M2 cross-validation
Independent global-M2 agrees (r = 0.90); the '10-week lead' vanishes in returns.
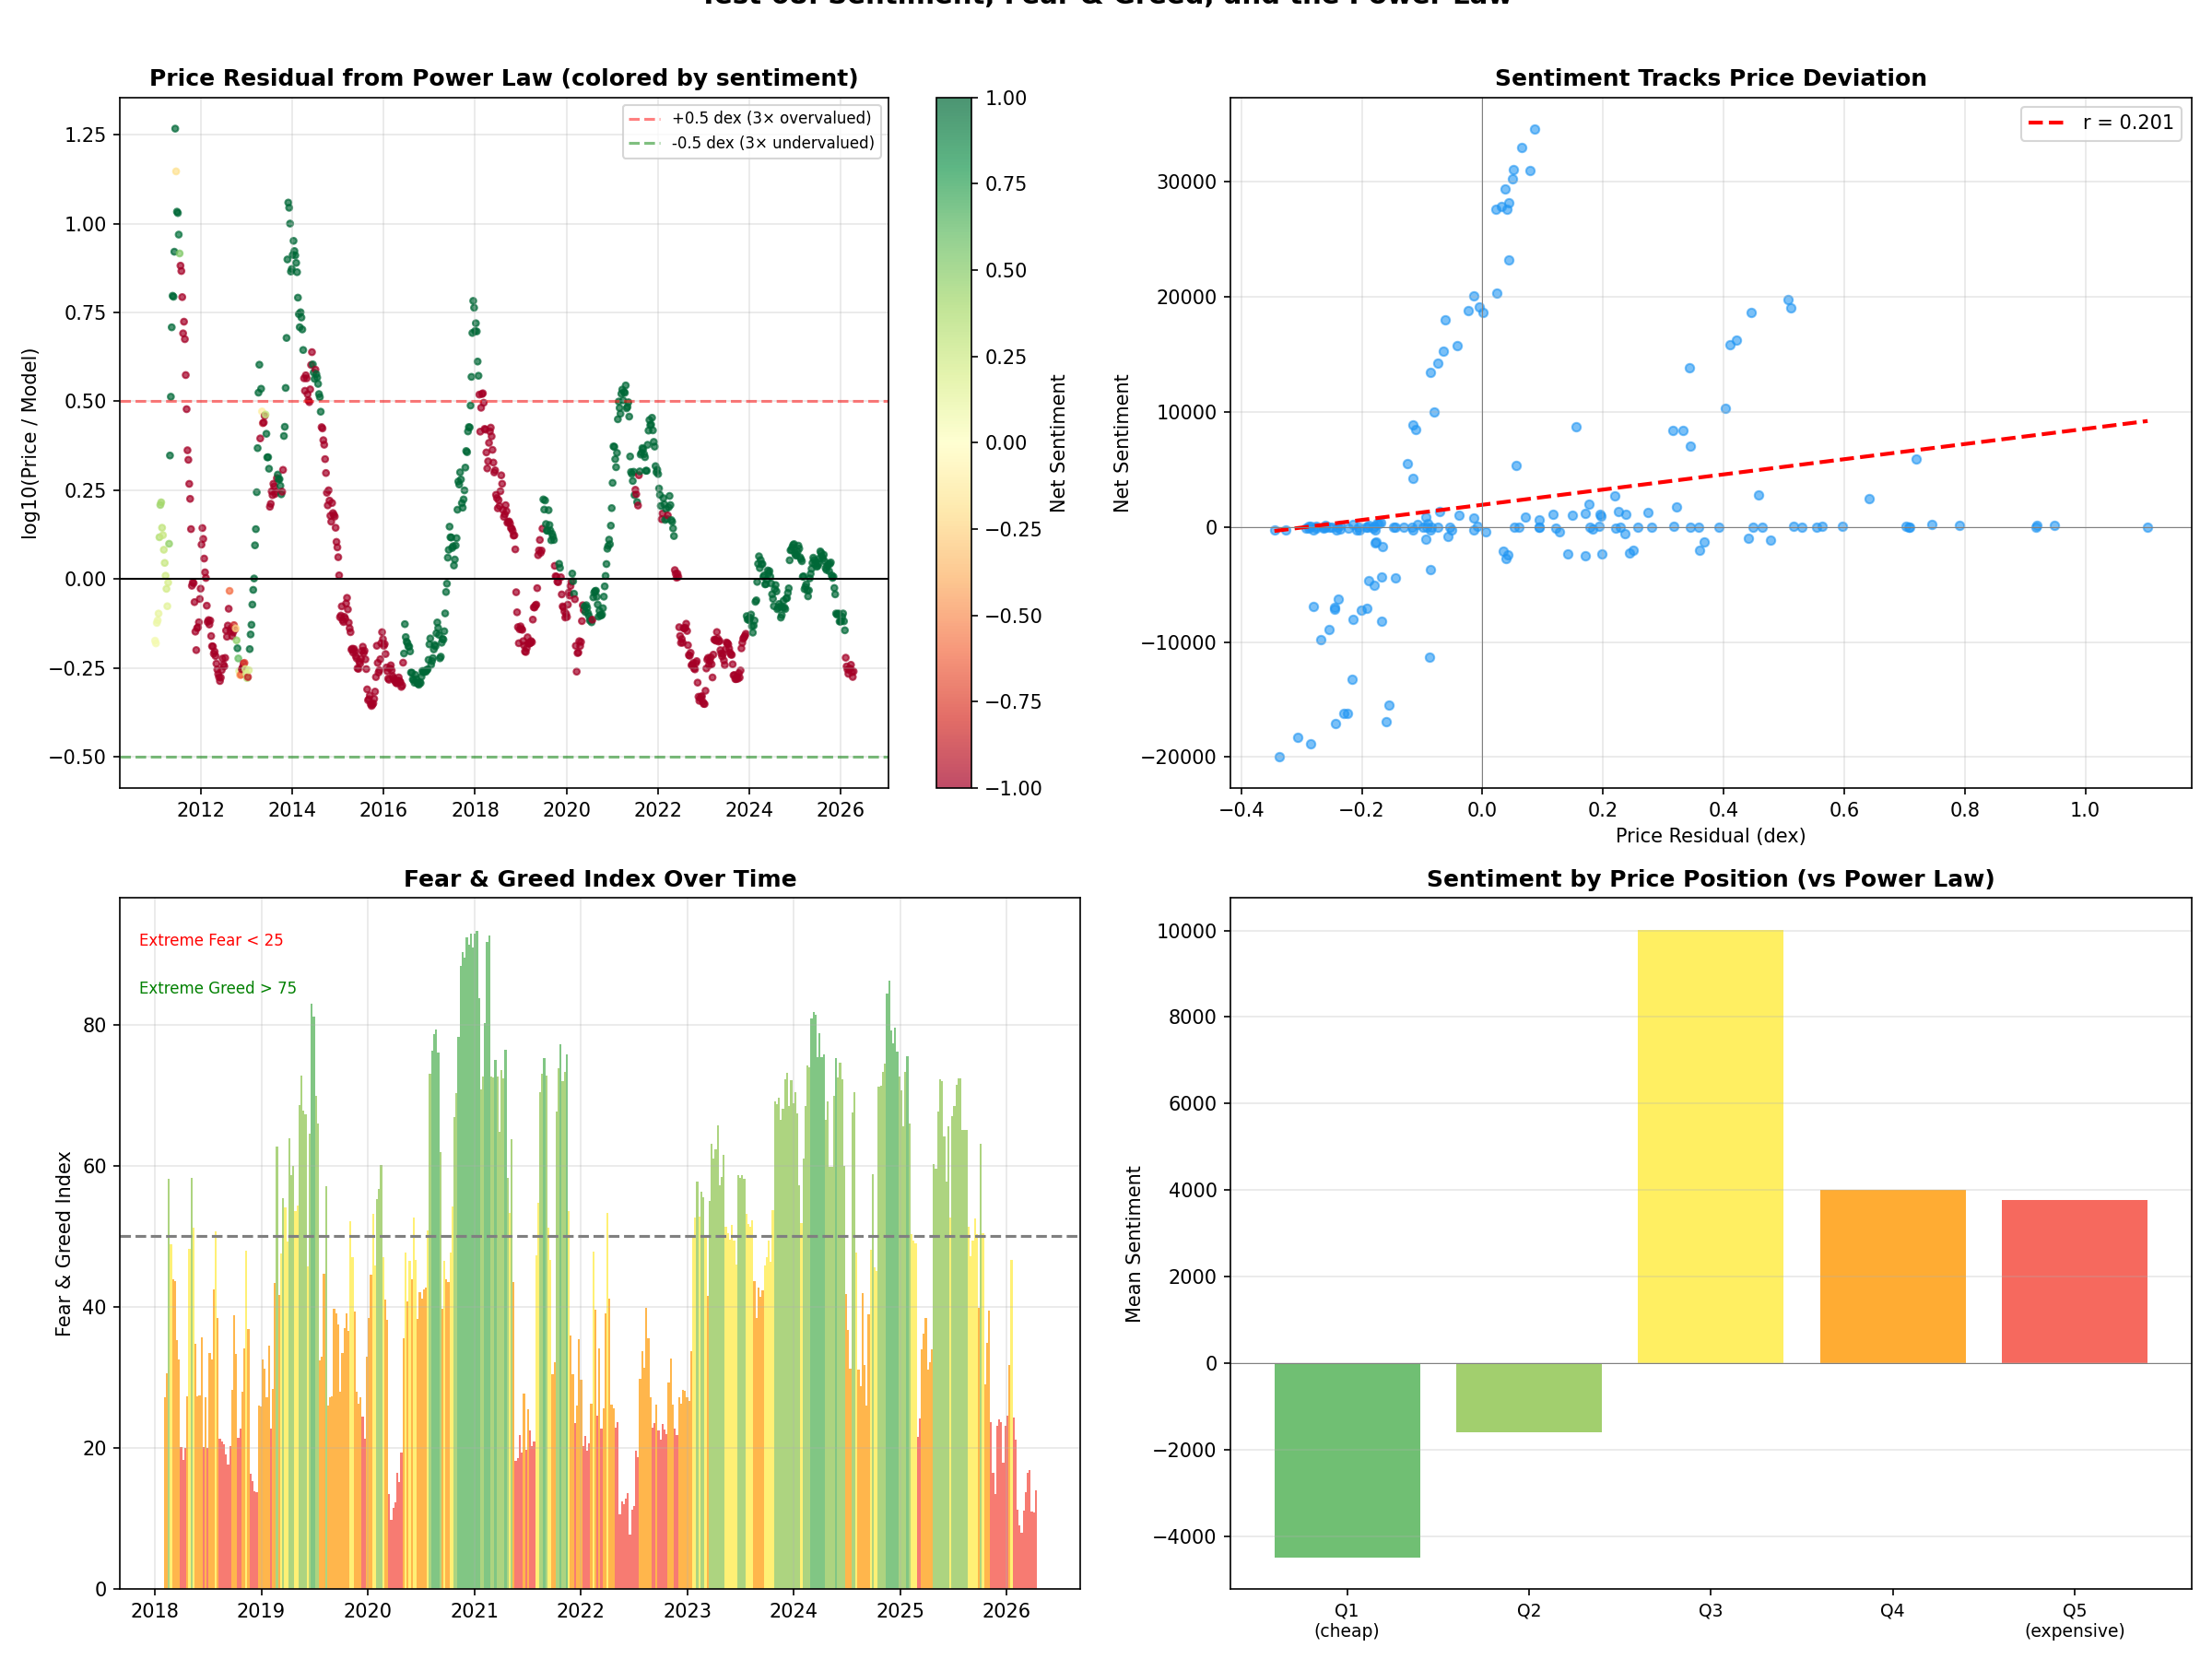
Sentiment figure
Test 68 corroborative
Sentiment
Sentiment lags the power-law residual - procyclical, not predictive.
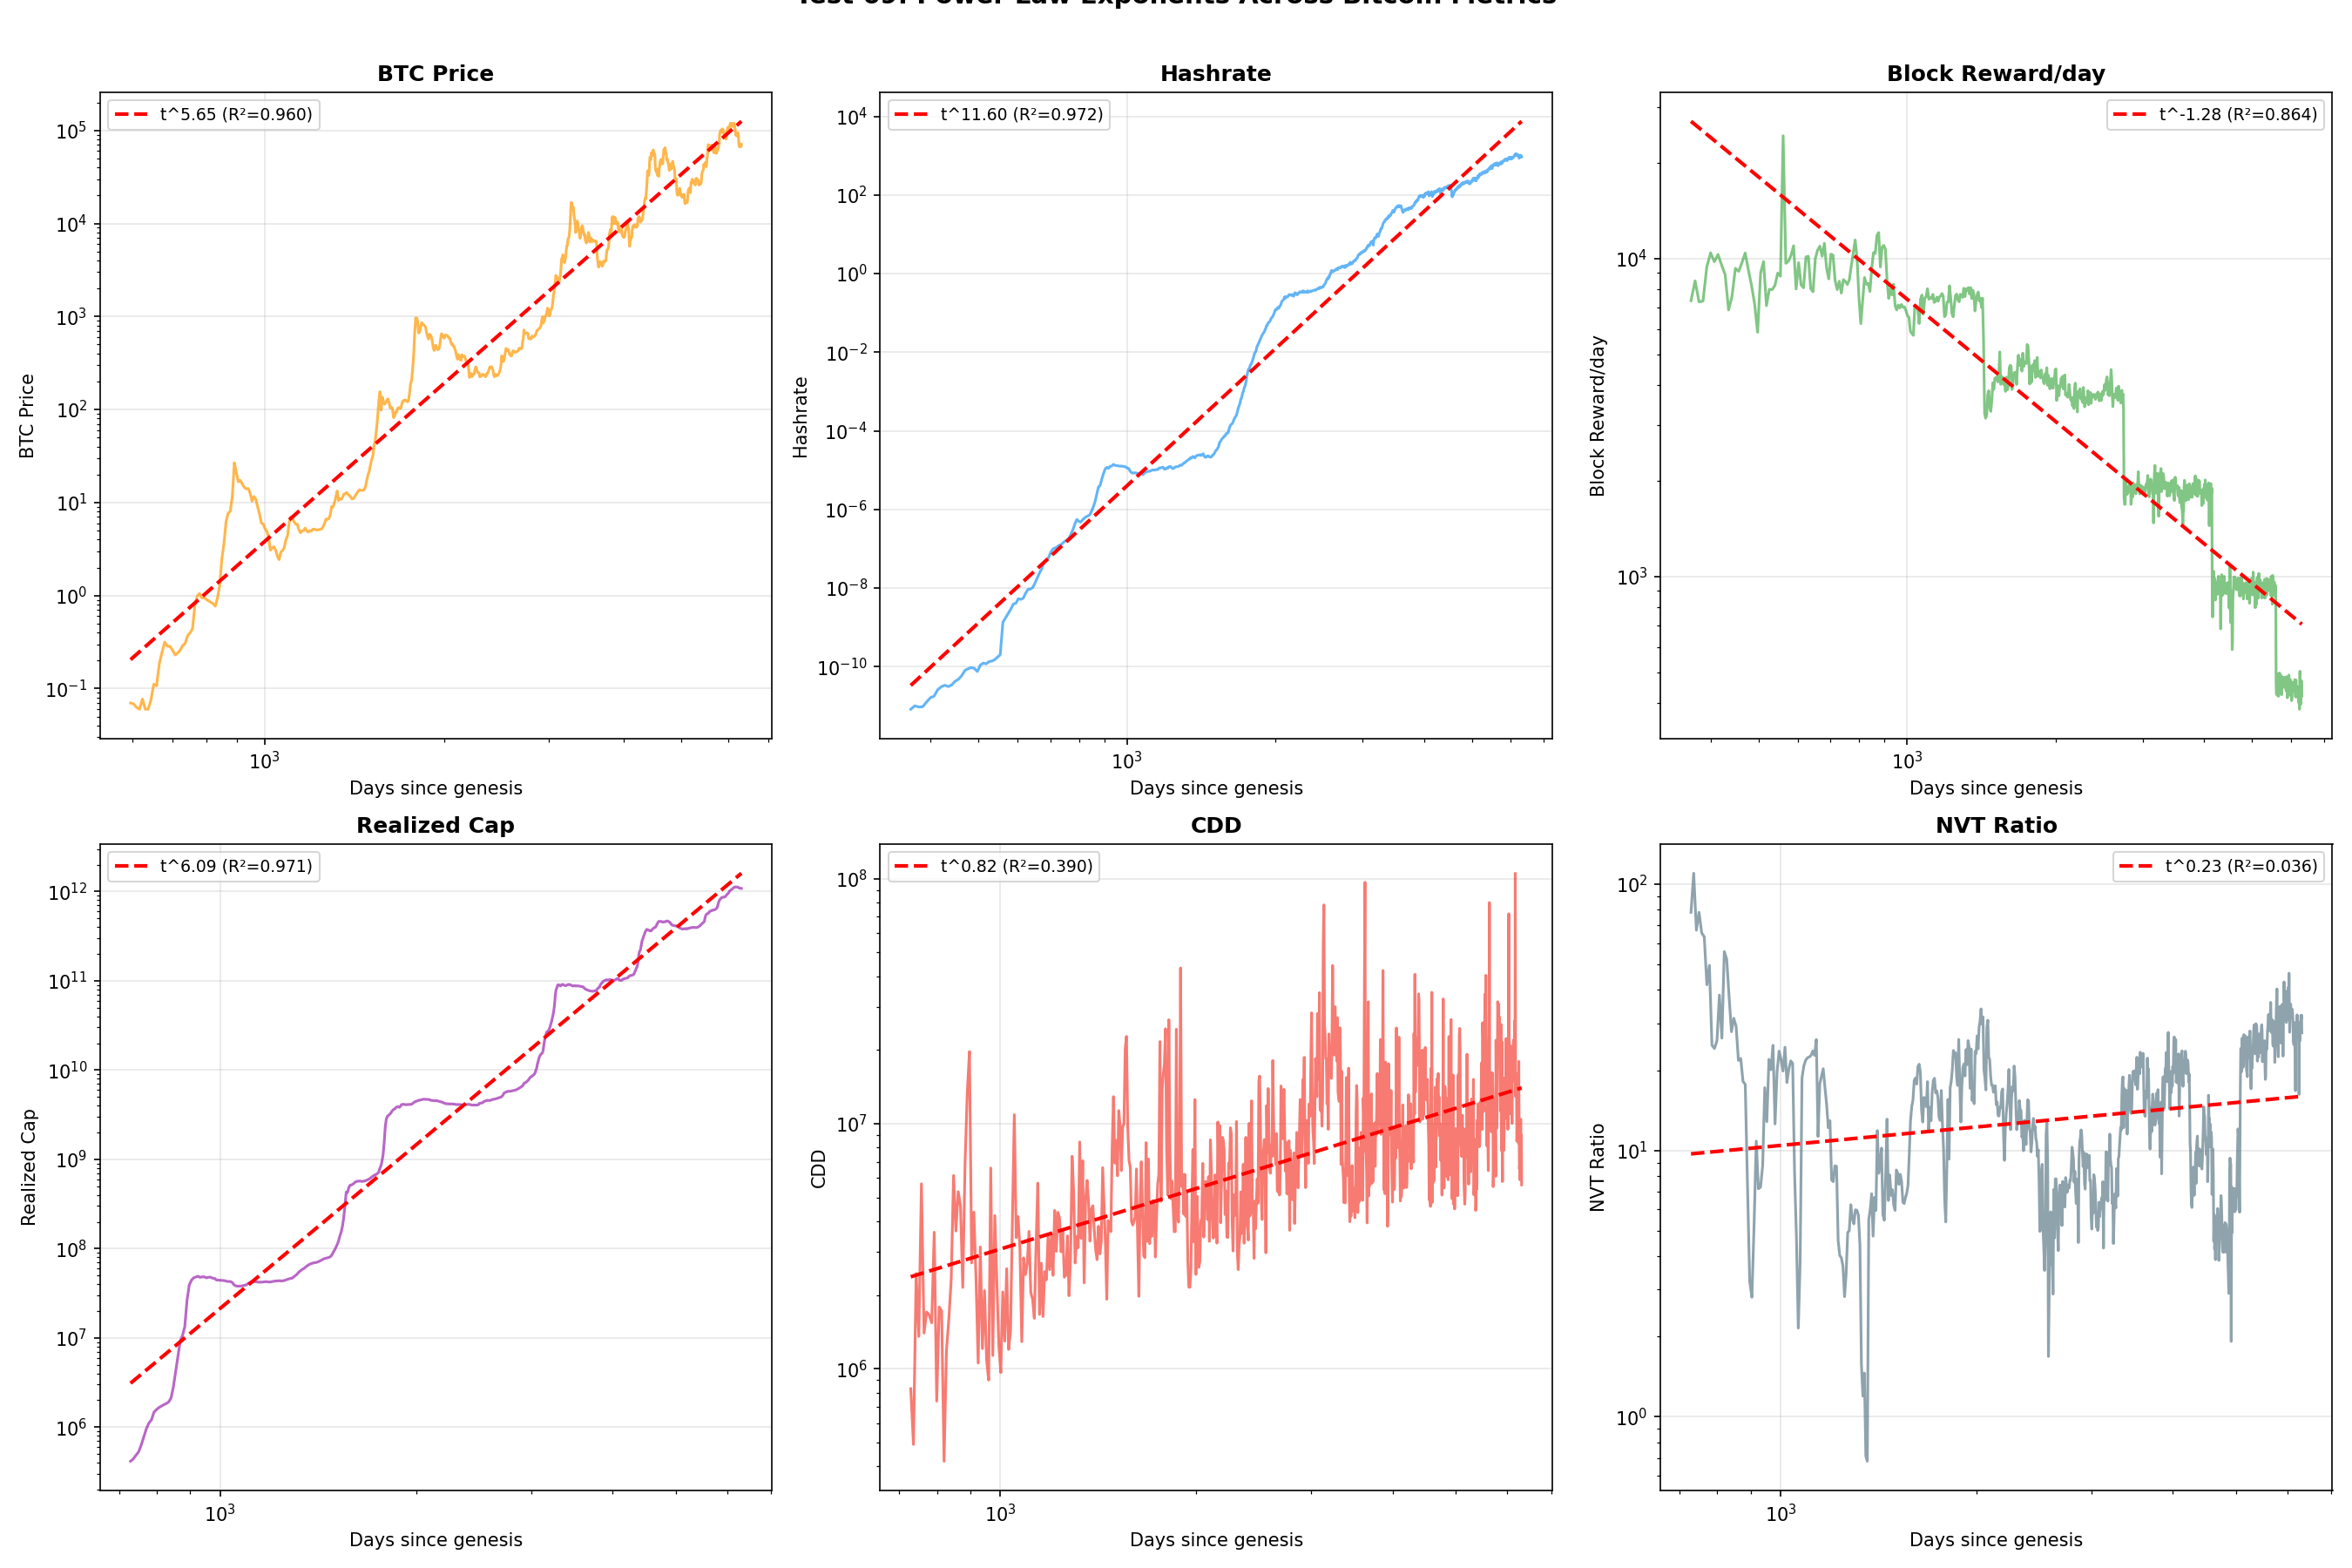
Metric exponents figure
Test 69 corroborative
Metric exponents
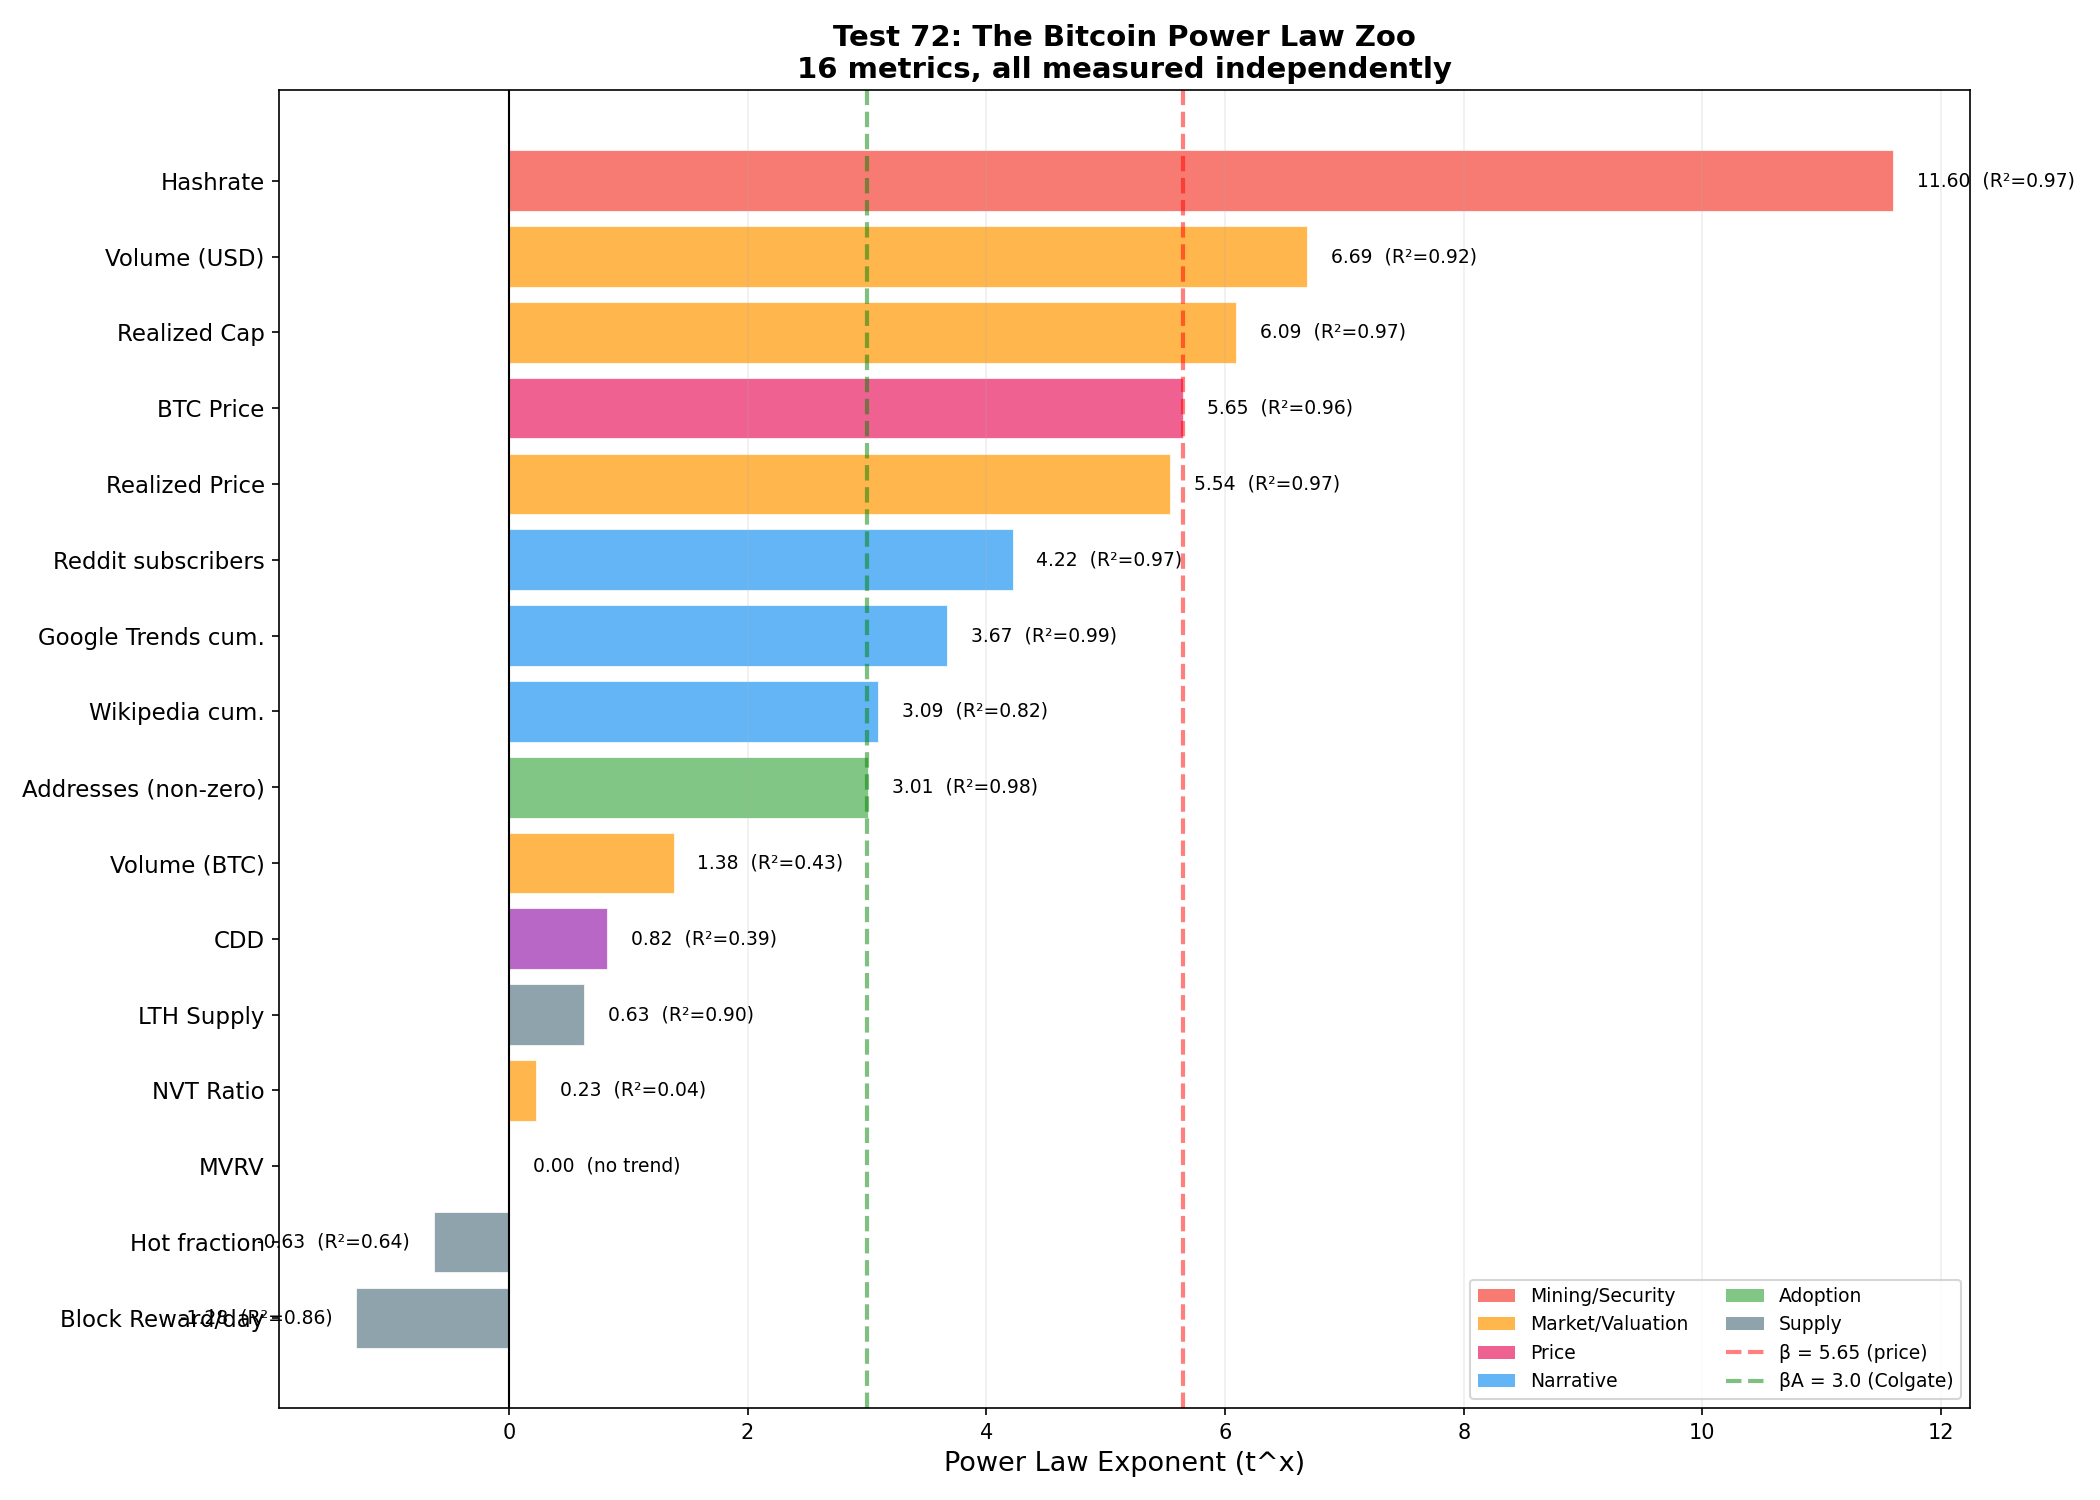
Hashrate ~ t^11.6 = 2 beta; MVRV exactly trend-neutral.
Feedback loop figure
Test 70 corroborative
Feedback loop
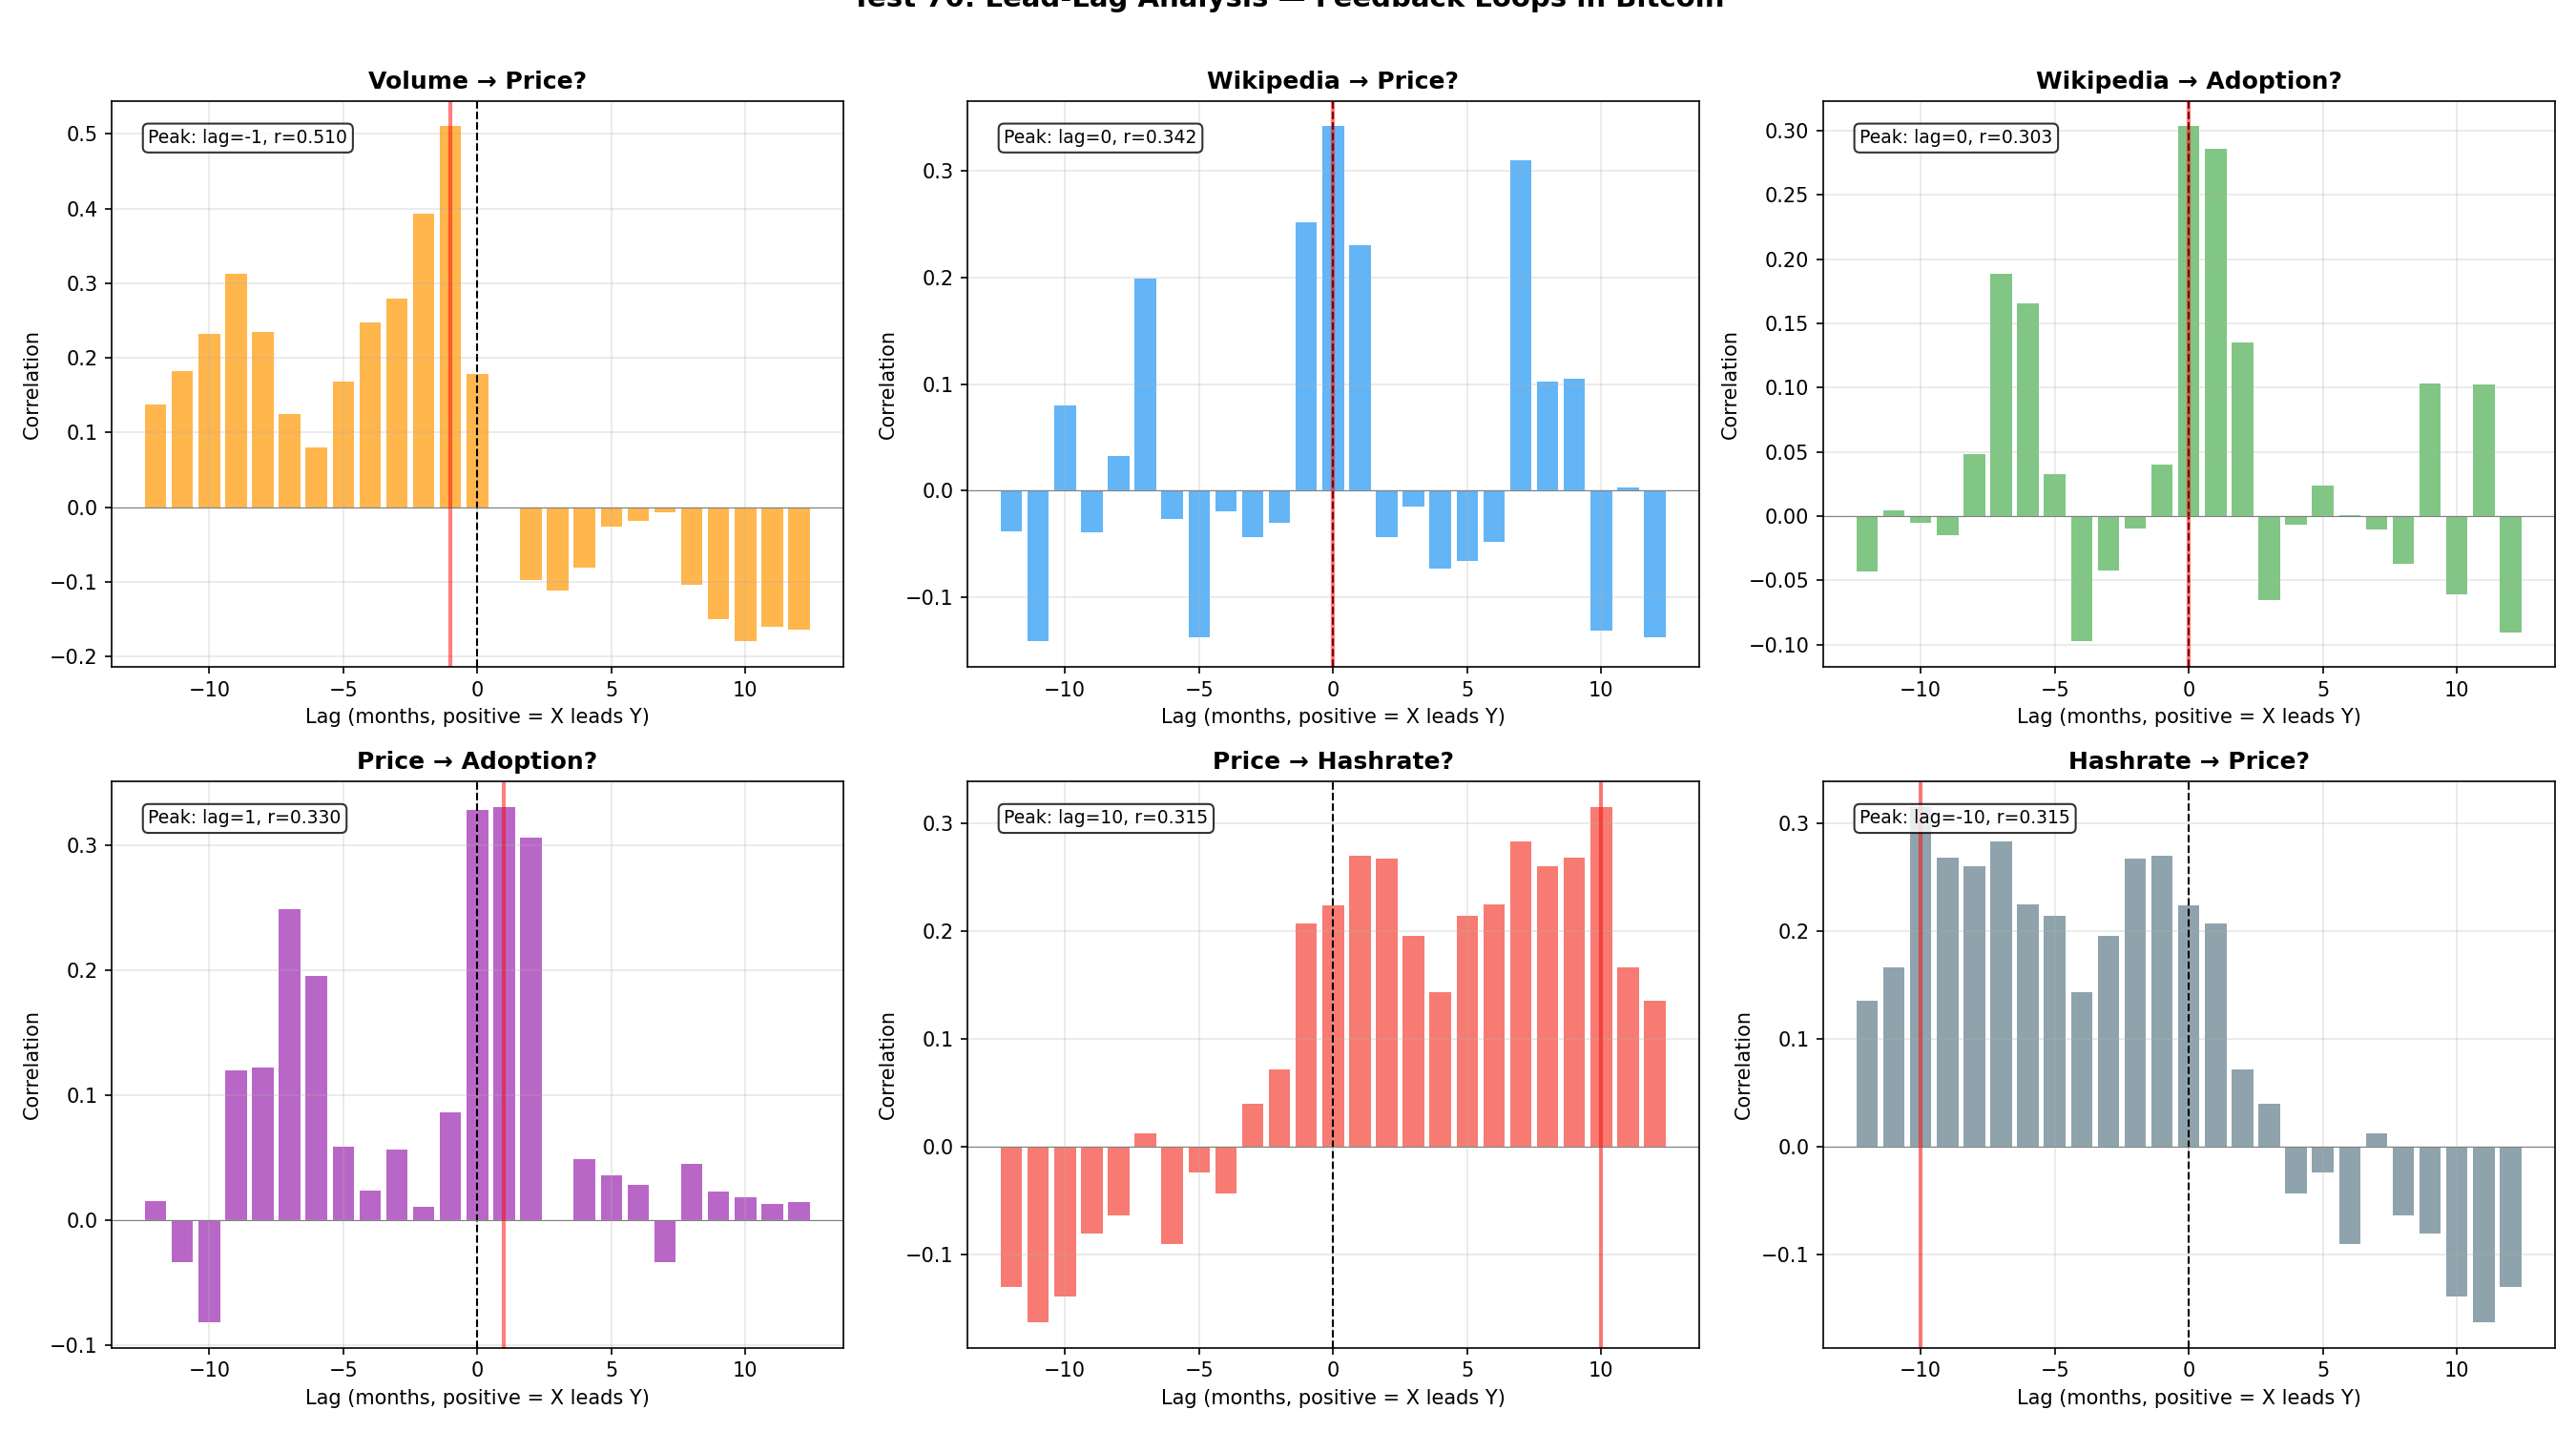
Narrative leads price; price leads adoption and hashrate.
Realized price + SOPR figure
Test 71 corroborative
Realized price + SOPR
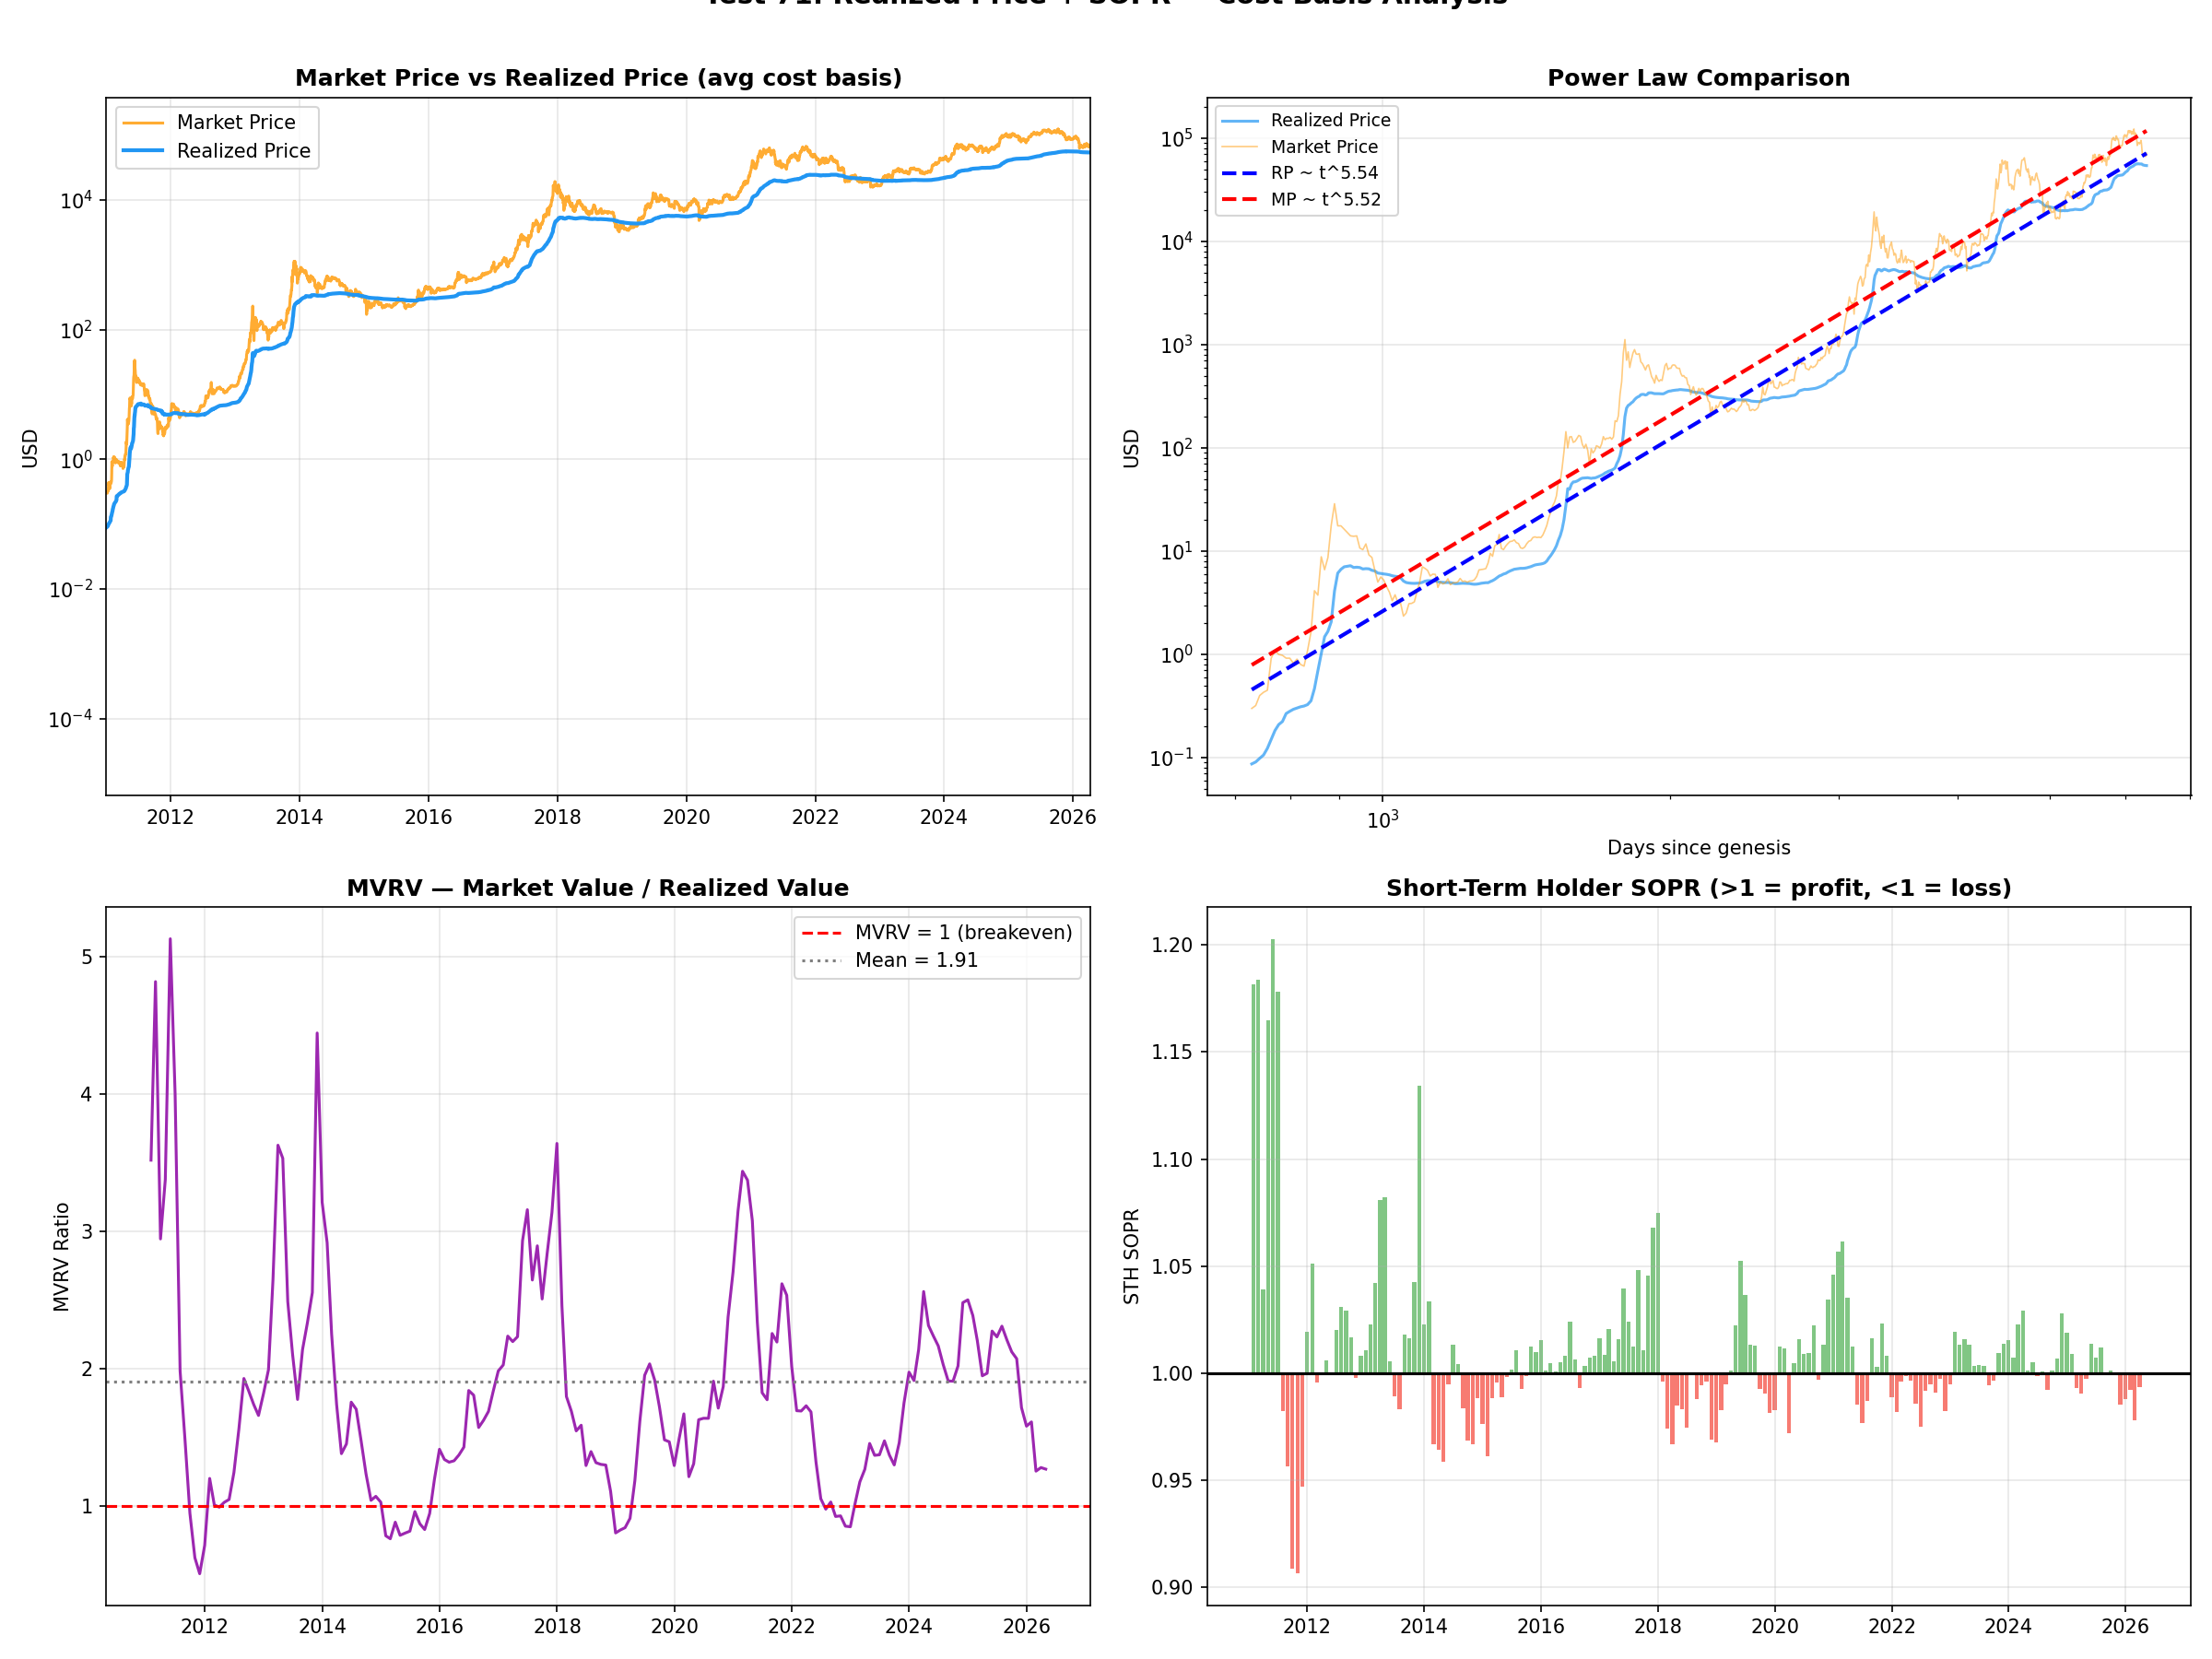
Aggregate cost basis grows at the same rate as price (t^5.54).
Power law zoo figure
Test 72 corroborative
Power law zoo
16 exponents, 7 algebraic relationships, all within 3.5%.

The adversarial round & external controls

alpha_implied mechanics figure
Test 73 ★ load-bearing
alpha_implied mechanics
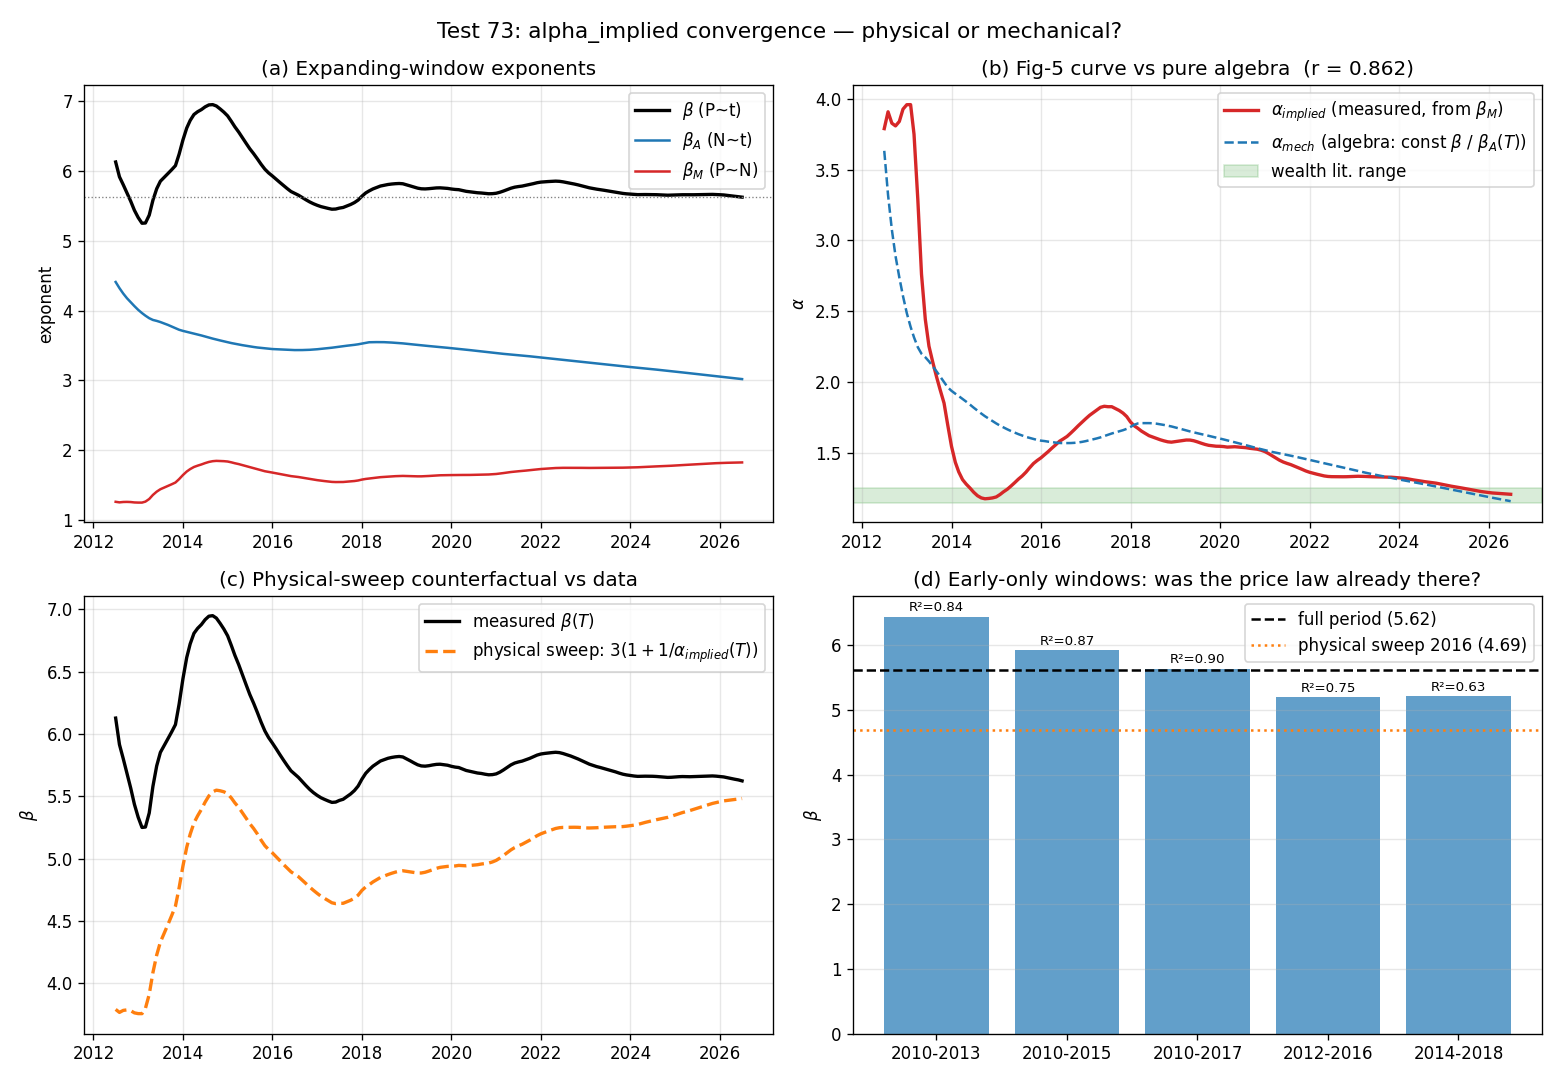
The 'convergence' plot is mechanical, not physical.
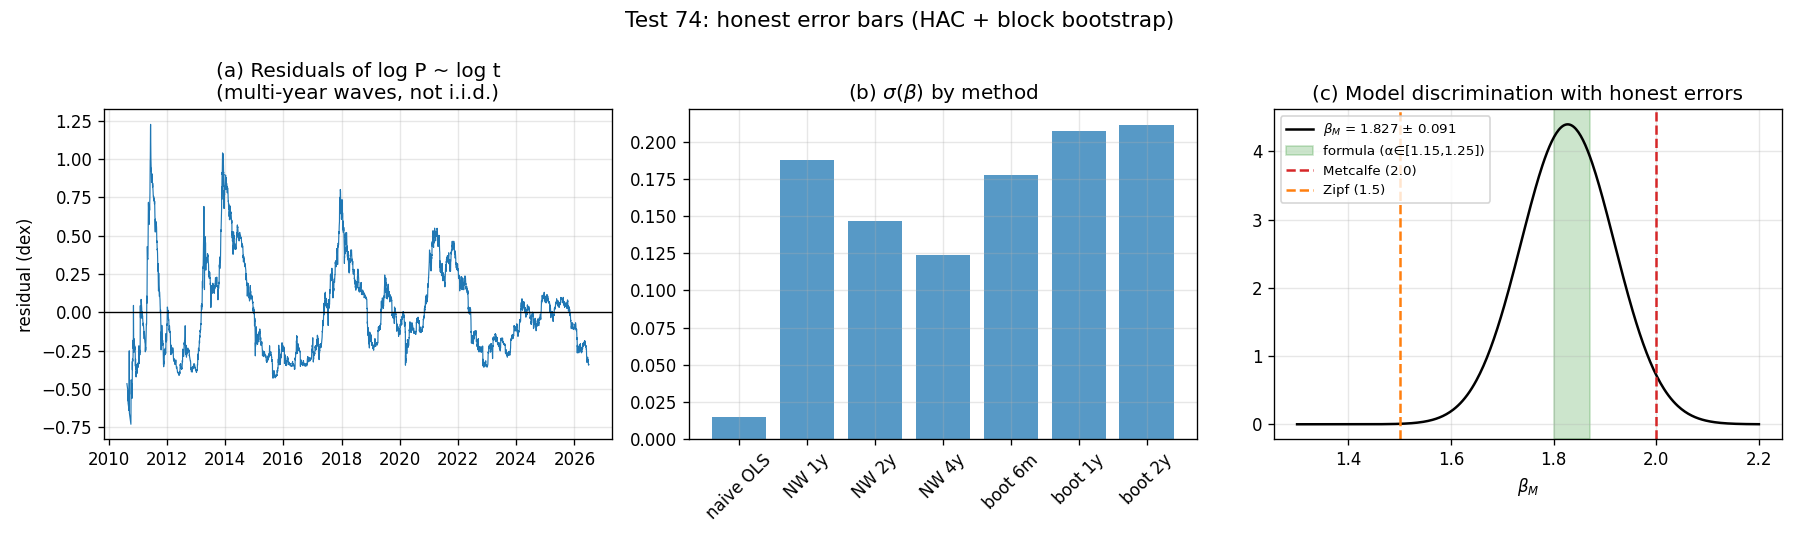
Honest error bars figure
Test 74 ★ load-bearing
Honest error bars
Real uncertainty is x14 naive: beta = 5.62 +/- 0.21.
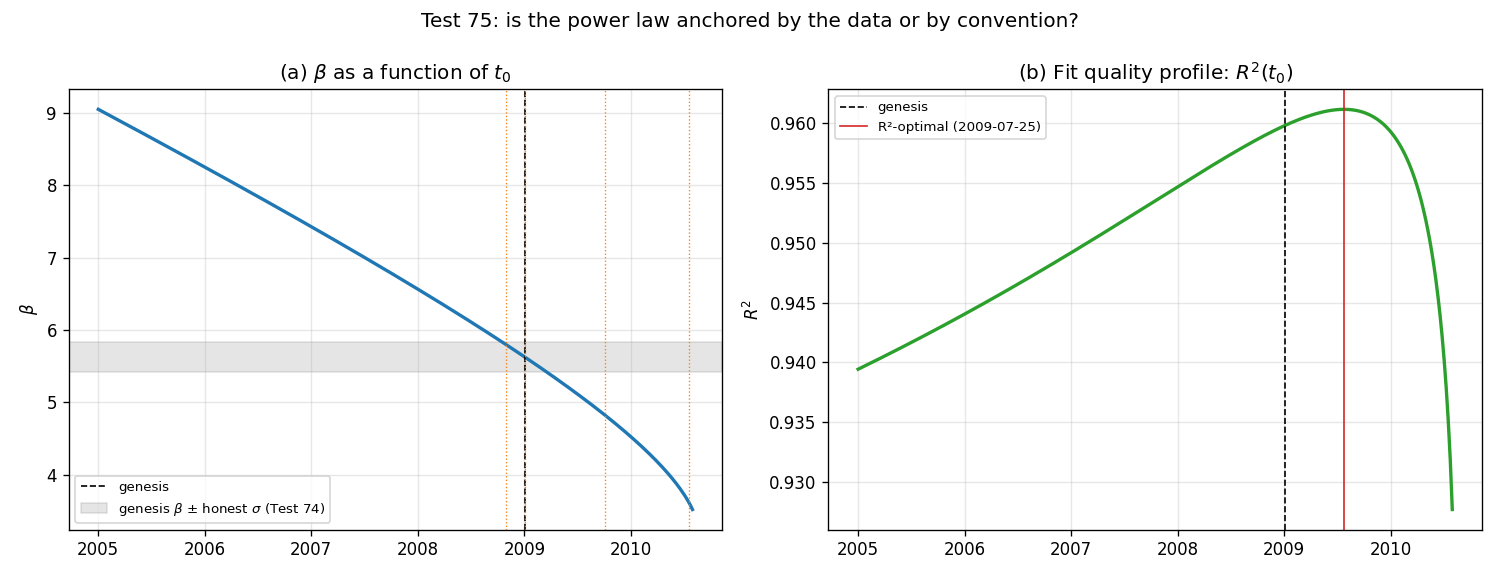
t0 sensitivity figure
Test 75 ★ load-bearing
t0 sensitivity
beta depends on the clock convention; betaM = 1.83 is the invariant.
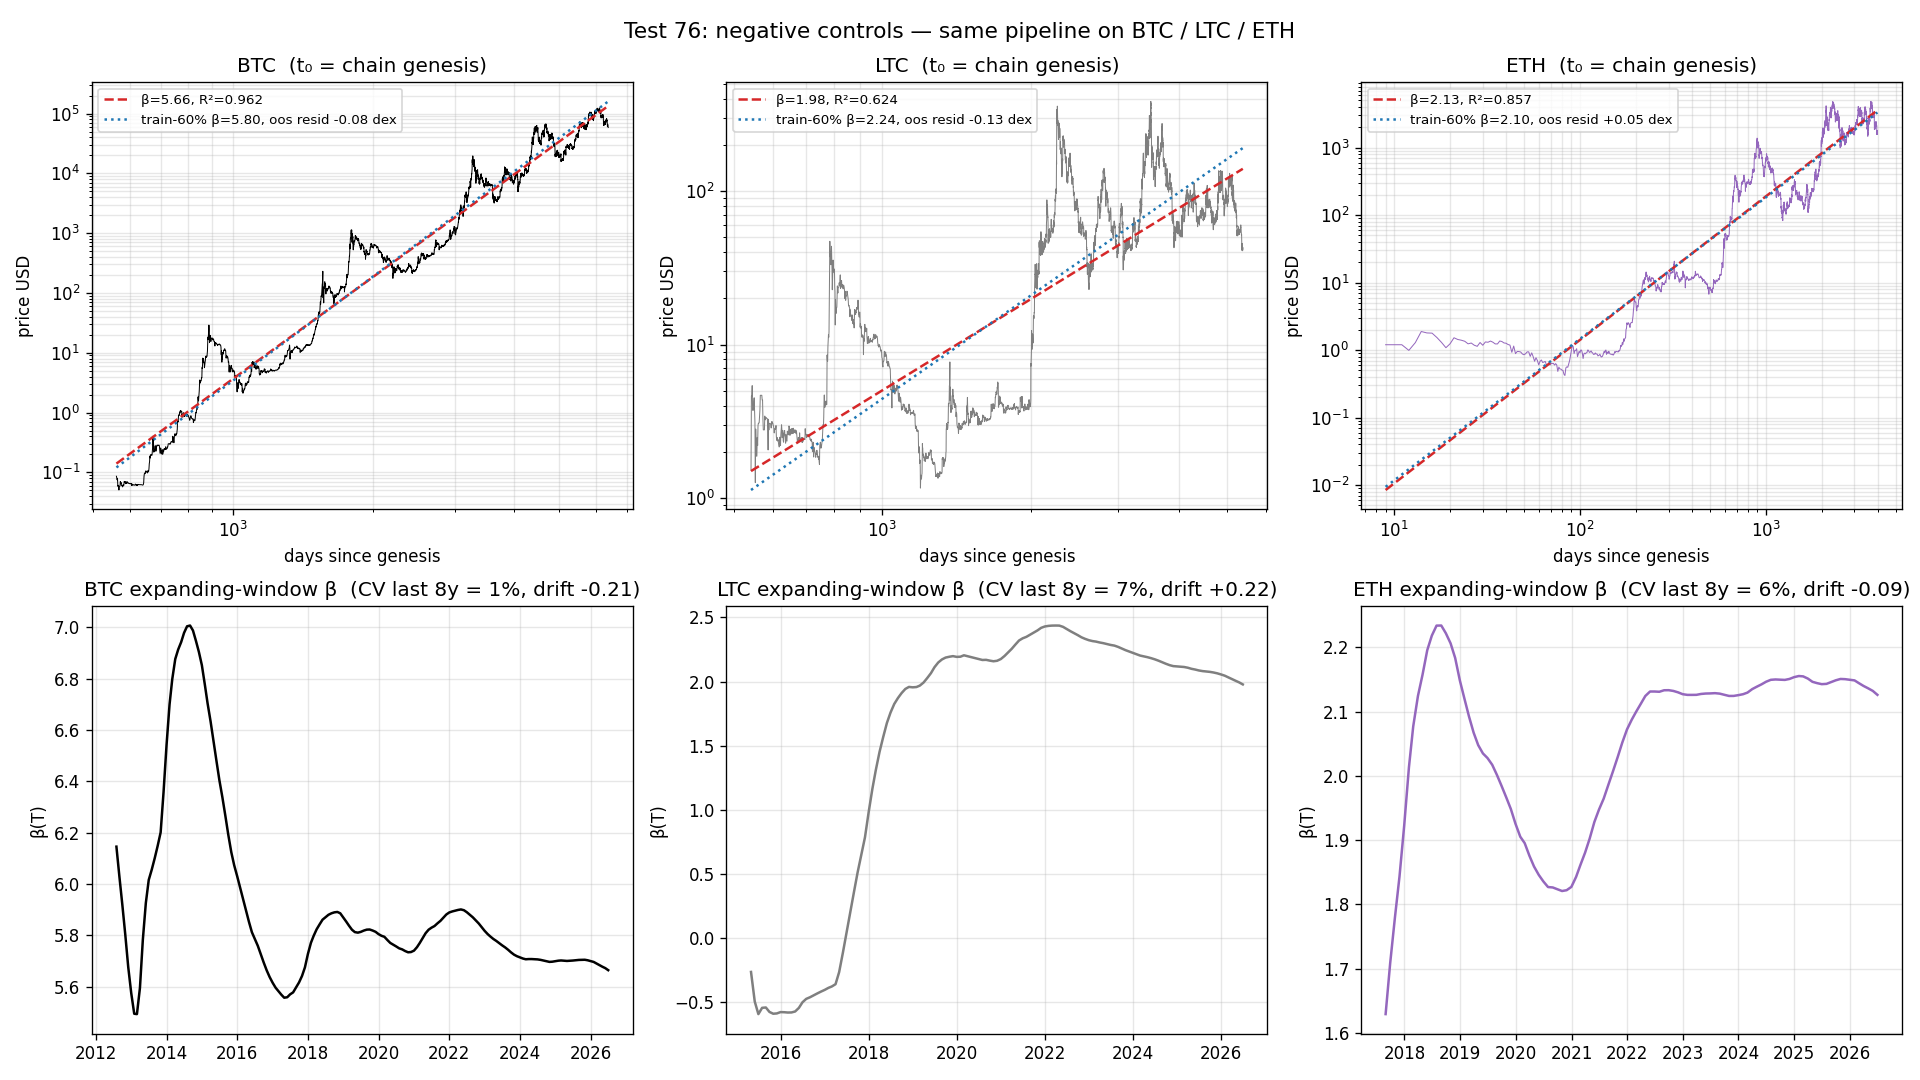
Negative controls figure
Test 76 ★ load-bearing
Negative controls
Only Bitcoin has the surplus: +0.84 vs ~0 for ETH and LTC.
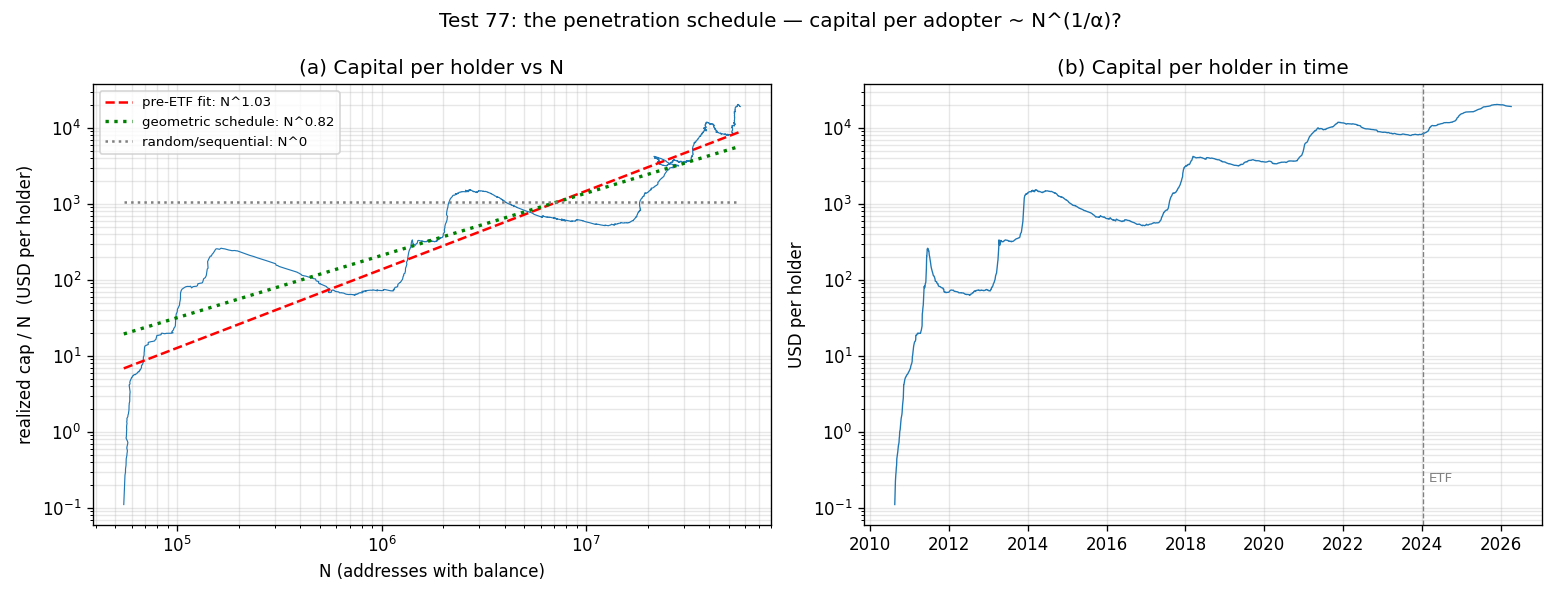
Penetration schedule figure
Test 77 ★ load-bearing
Penetration schedule
Capital/holder ~ N^1.0 where flat orderings predict N^0.
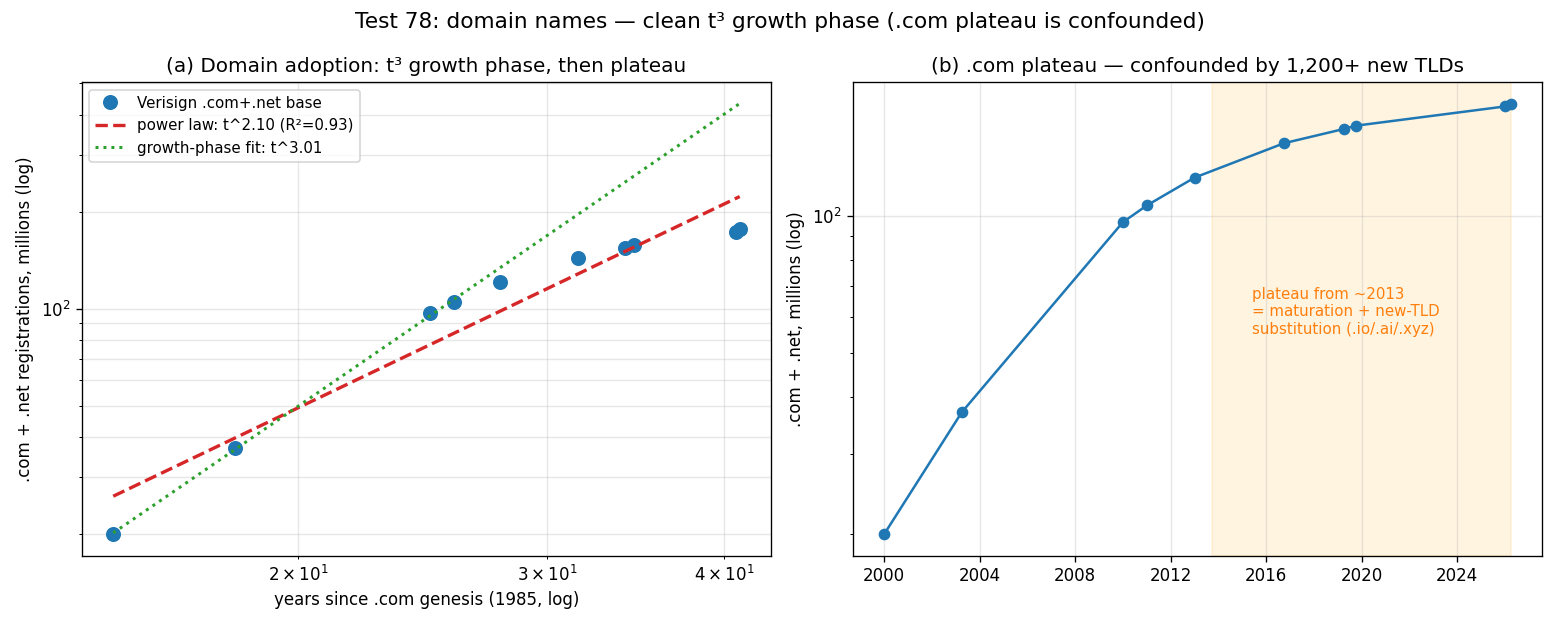
Domain names figure
Test 78 ★ load-bearing
Domain names
A non-crypto cognitive epidemic with scarcity: betaA = 3.01.
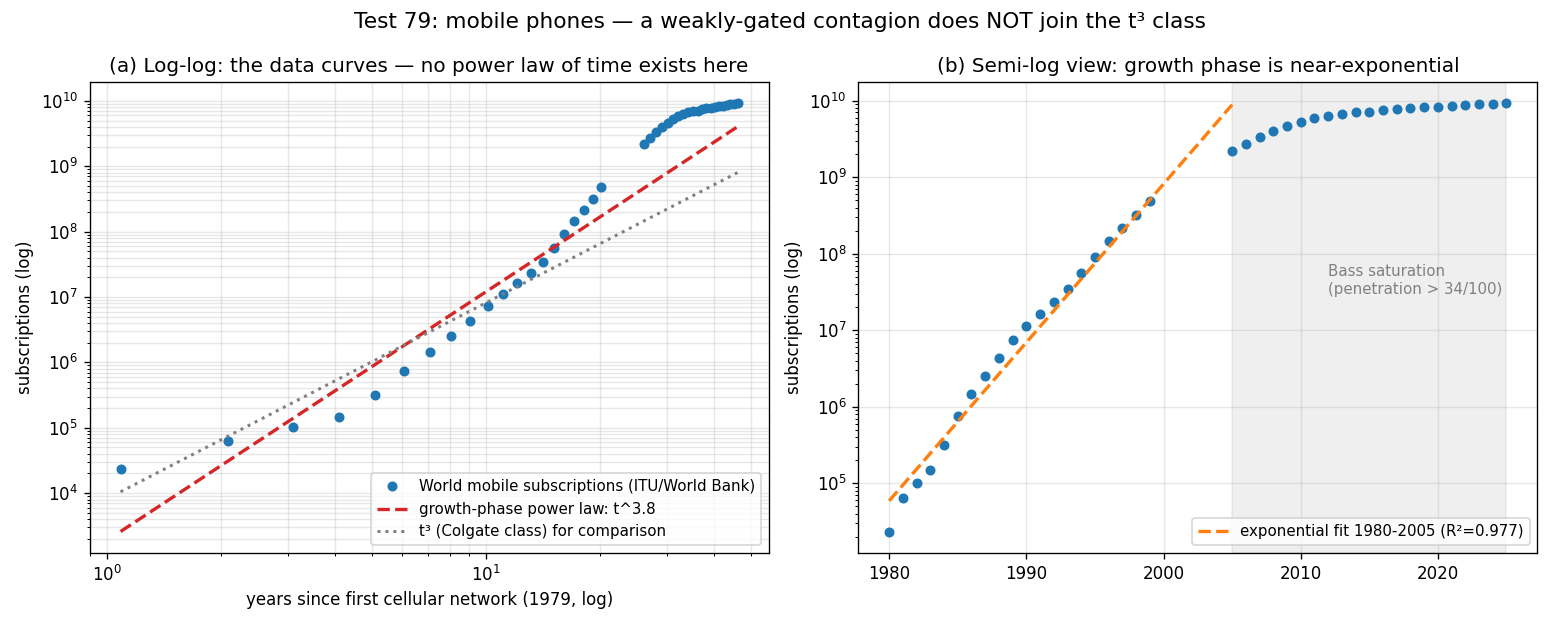
Mobile phones figure
Test 79 ★ load-bearing
Mobile phones
A weakly-gated contagion grows exponentially, not as t³ - registered prediction.
documentary — no figure
Test 80 corroborative
Cross-sectional Metcalfe
A 4-point cross-chain fit cannot constrain the exponent.
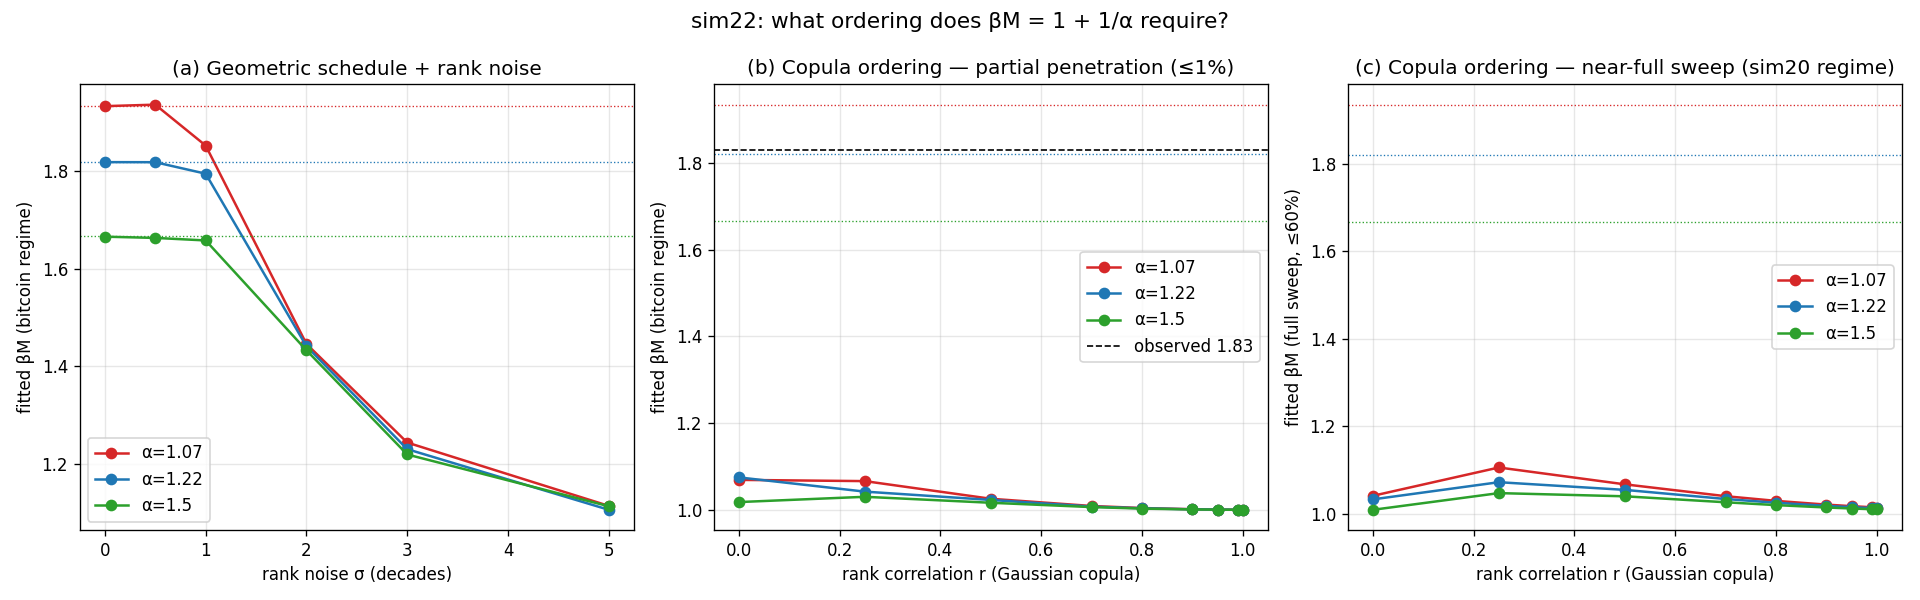
Ordering noise (simulation) figure
sim22 ★ load-bearing
Ordering noise (simulation)
The surplus requires geometric tail penetration; rank ordering produces none.
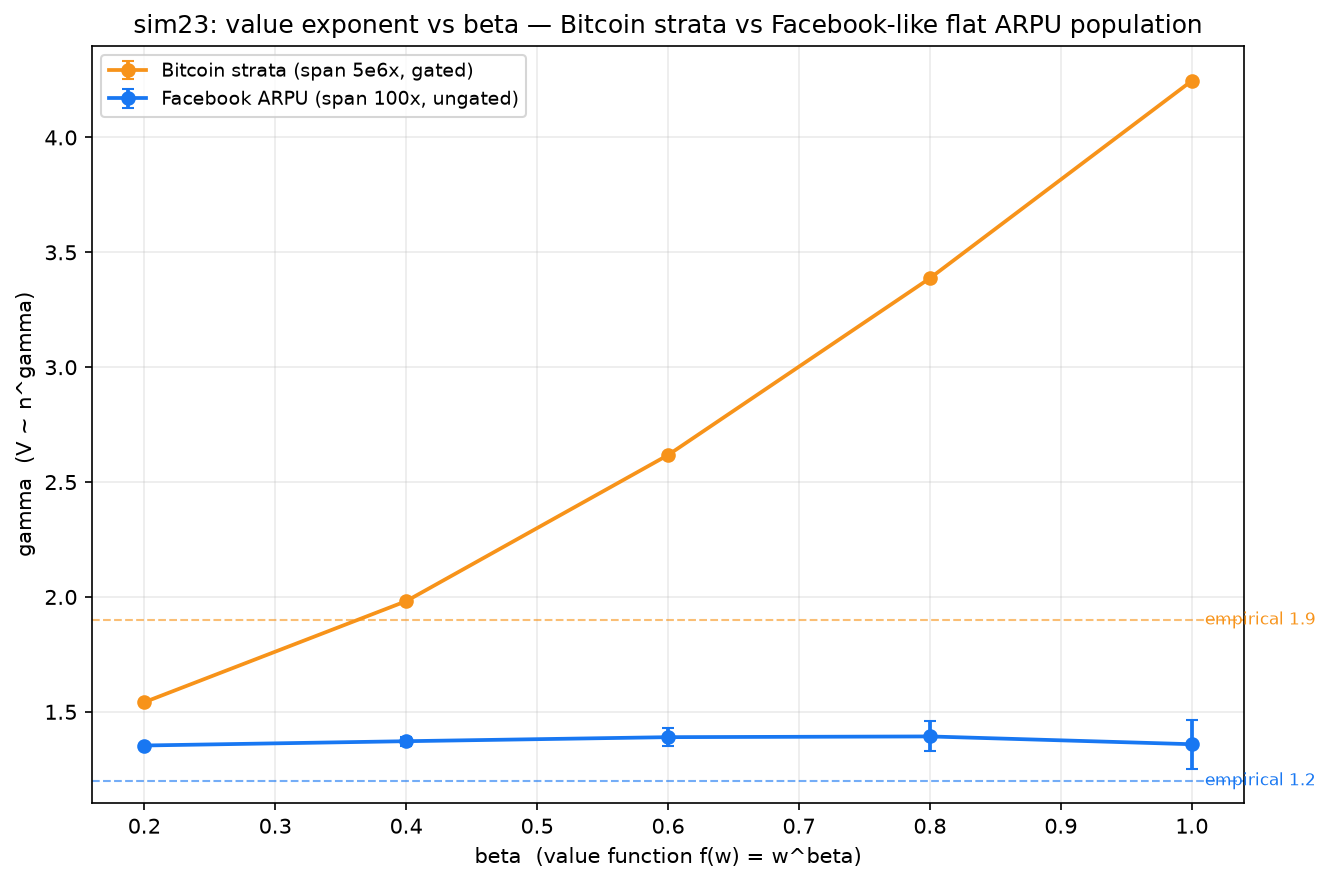
Facebook beta (simulation) figure
sim23 corroborative
Facebook beta (simulation)
On a flat ARPU population the social-network value exponent needs no wealth mechanism.
Empirical weights (simulation) figure
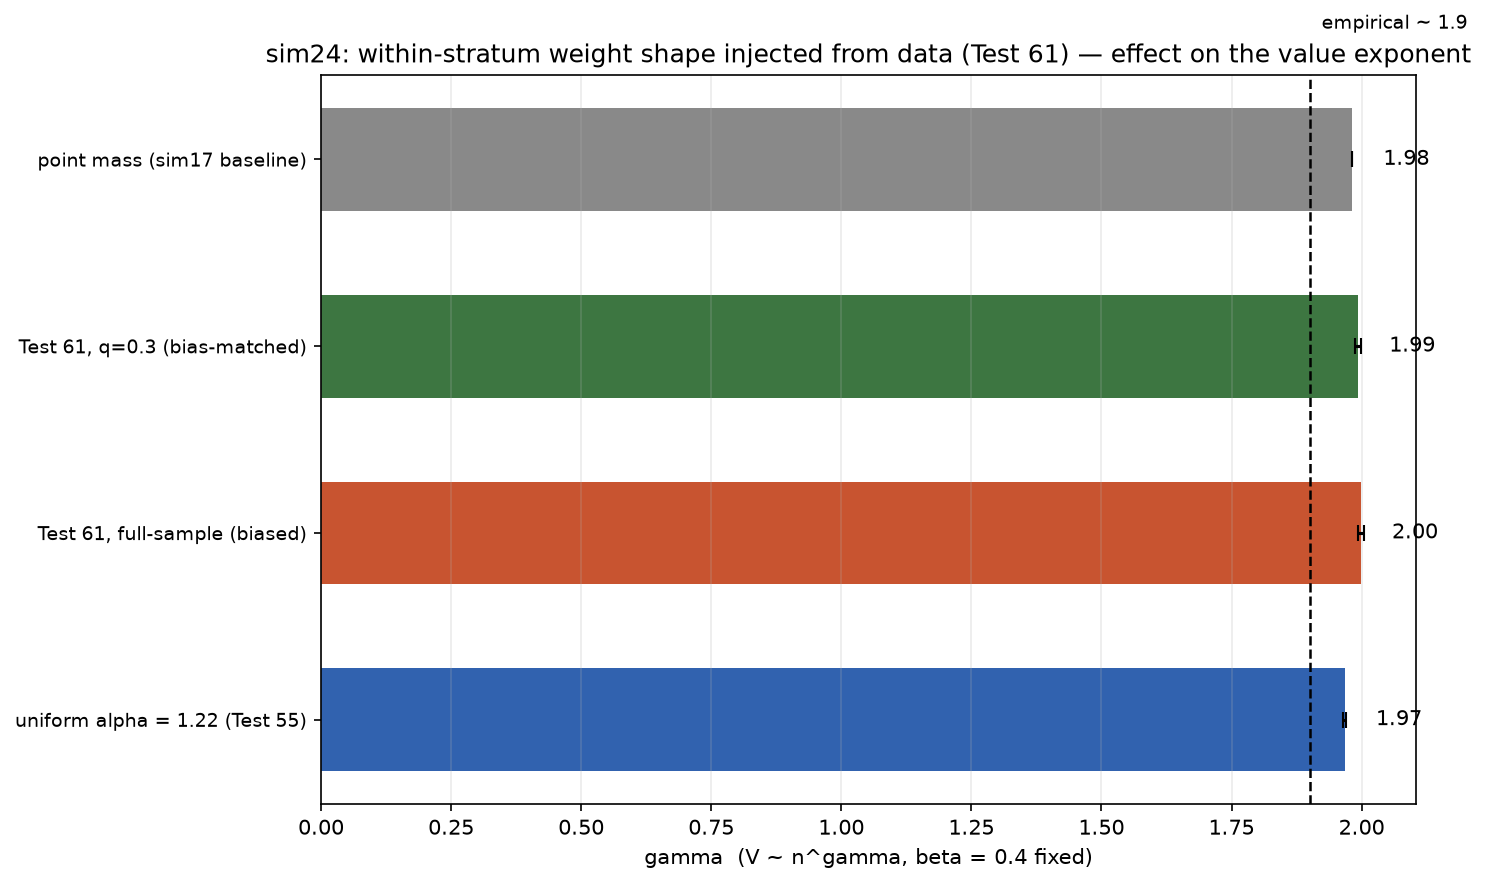
sim24 corroborative
Empirical weights (simulation)
Injecting measured per-stratum Pareto shapes leaves gamma unchanged: the hand-set weights did no hidden work.

Agent-based simulations — the exploration record

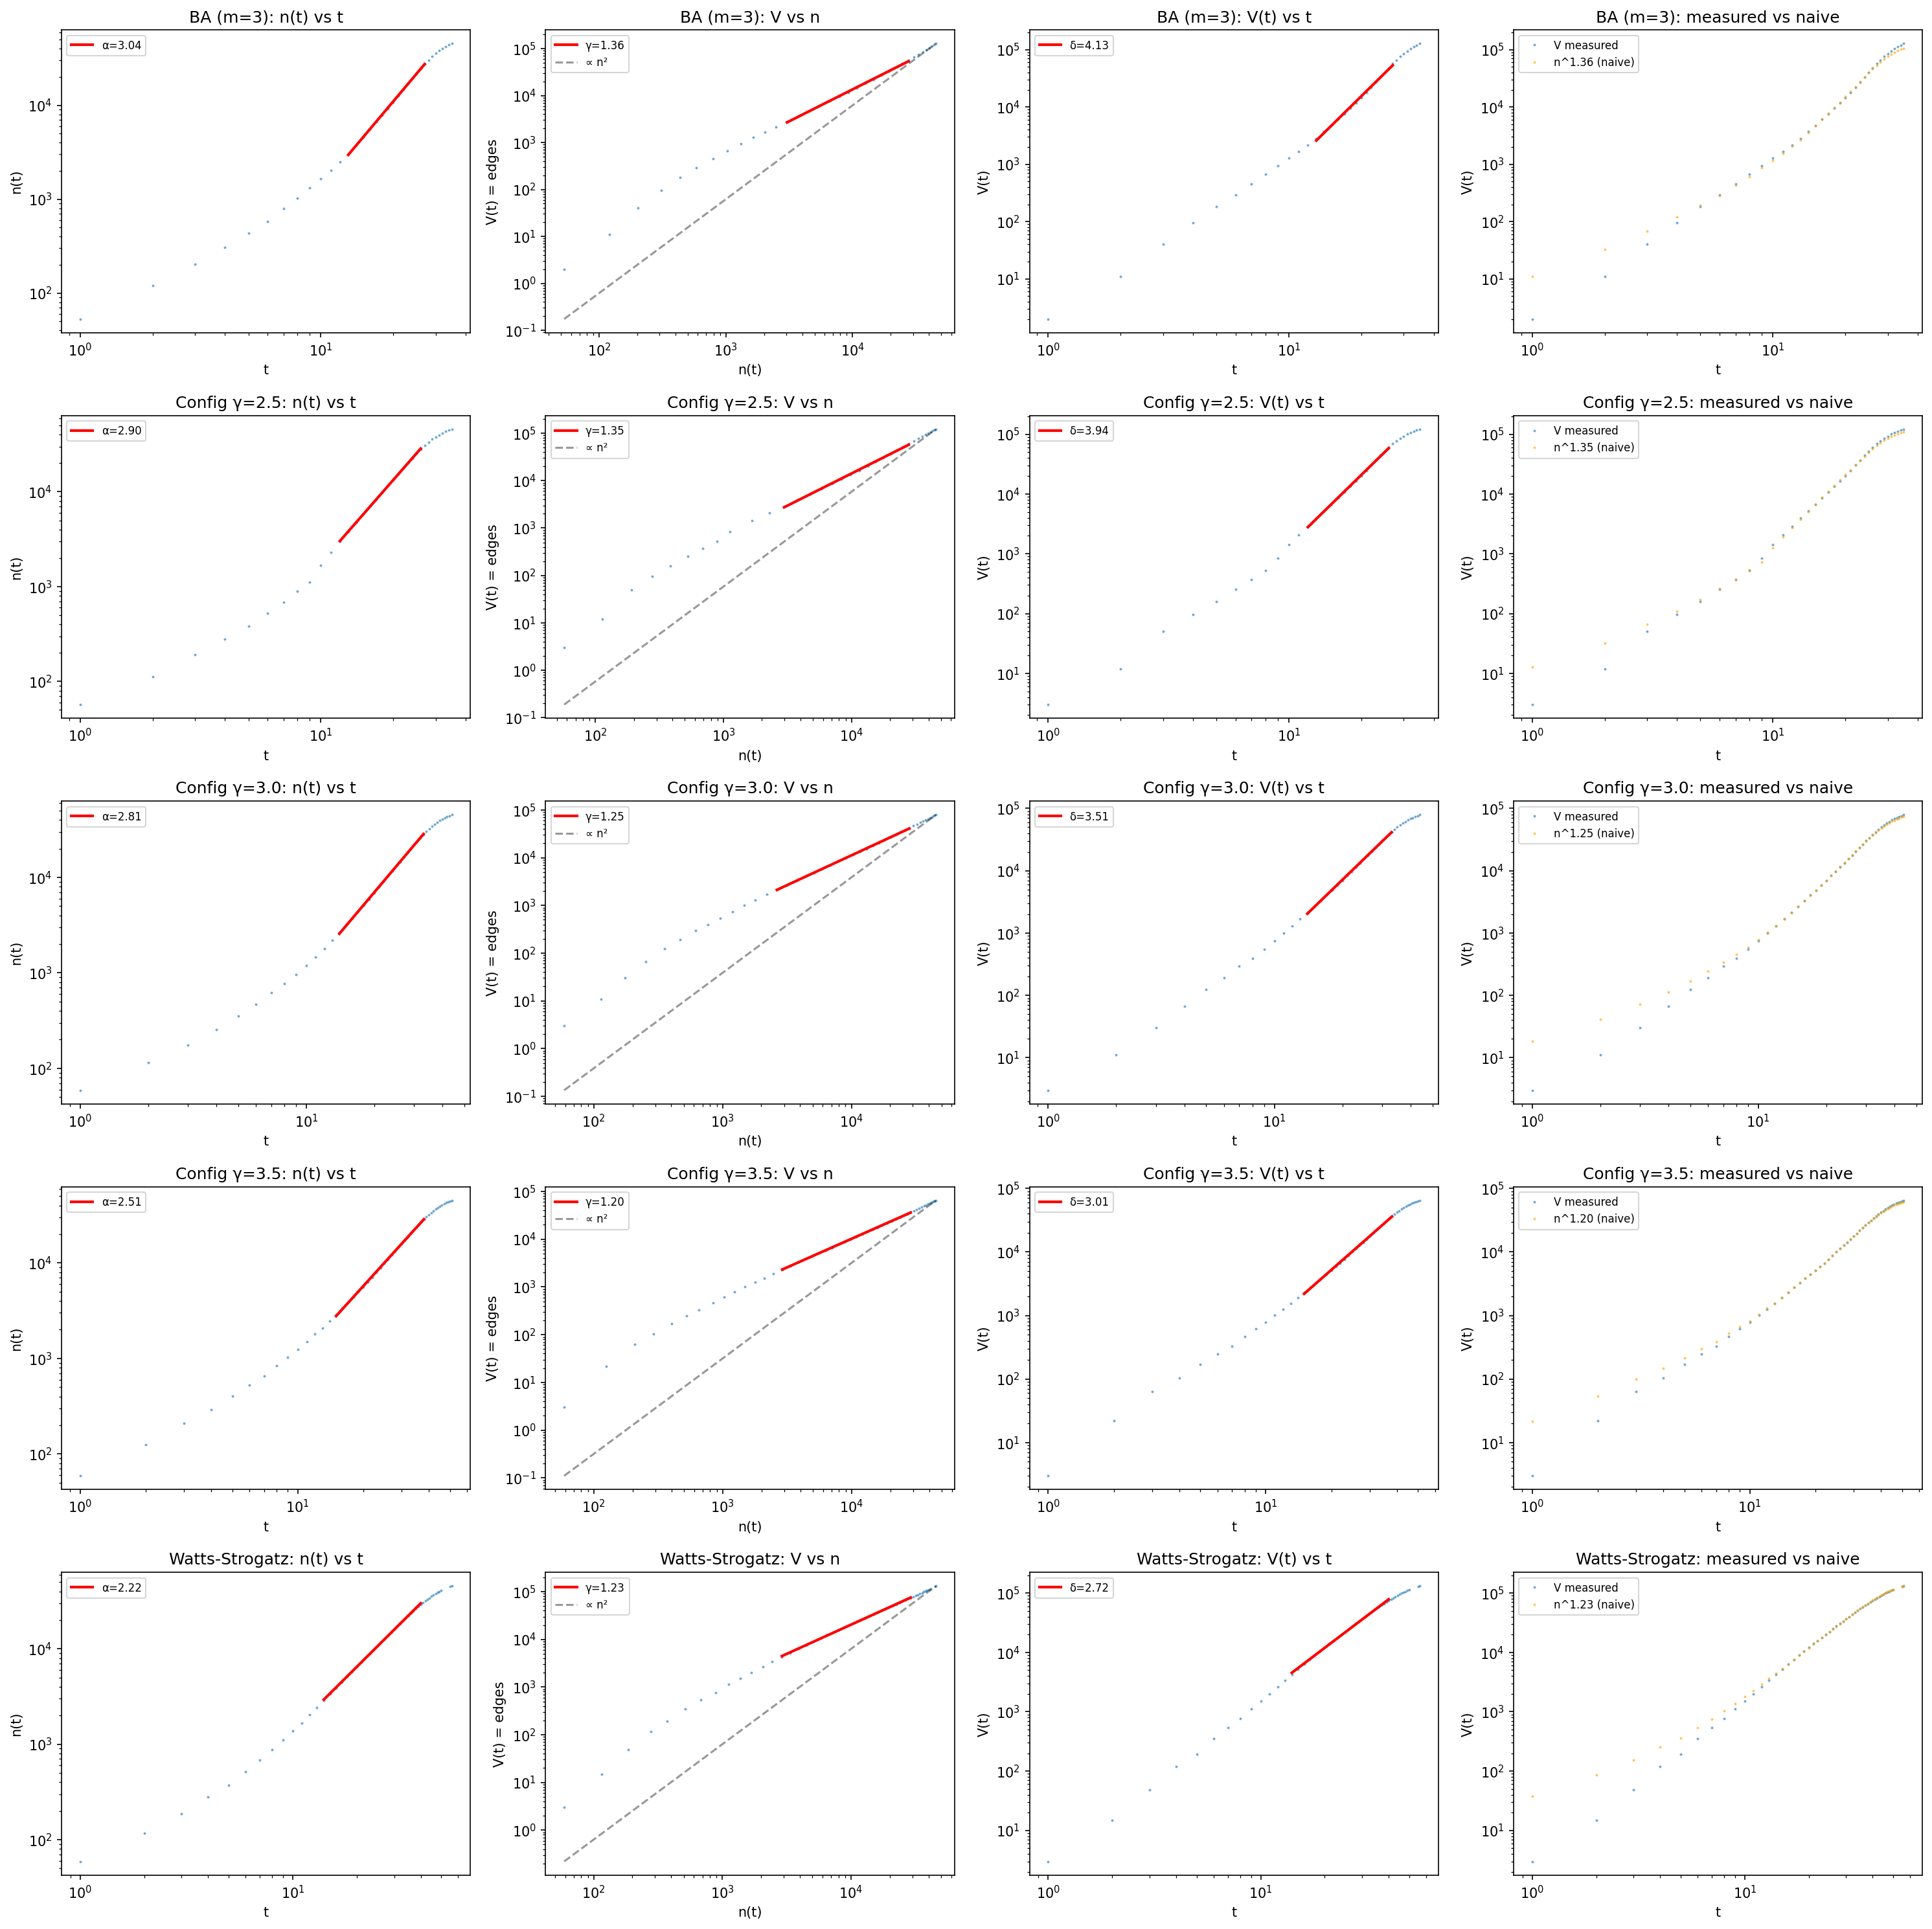
Composition delta = alpha x gamma figure
sim01 corroborative
Composition delta = alpha x gamma
Is the temporal exponent the product of adoption and value exponents? Exactly — ratio 1.000 across all five topologies.
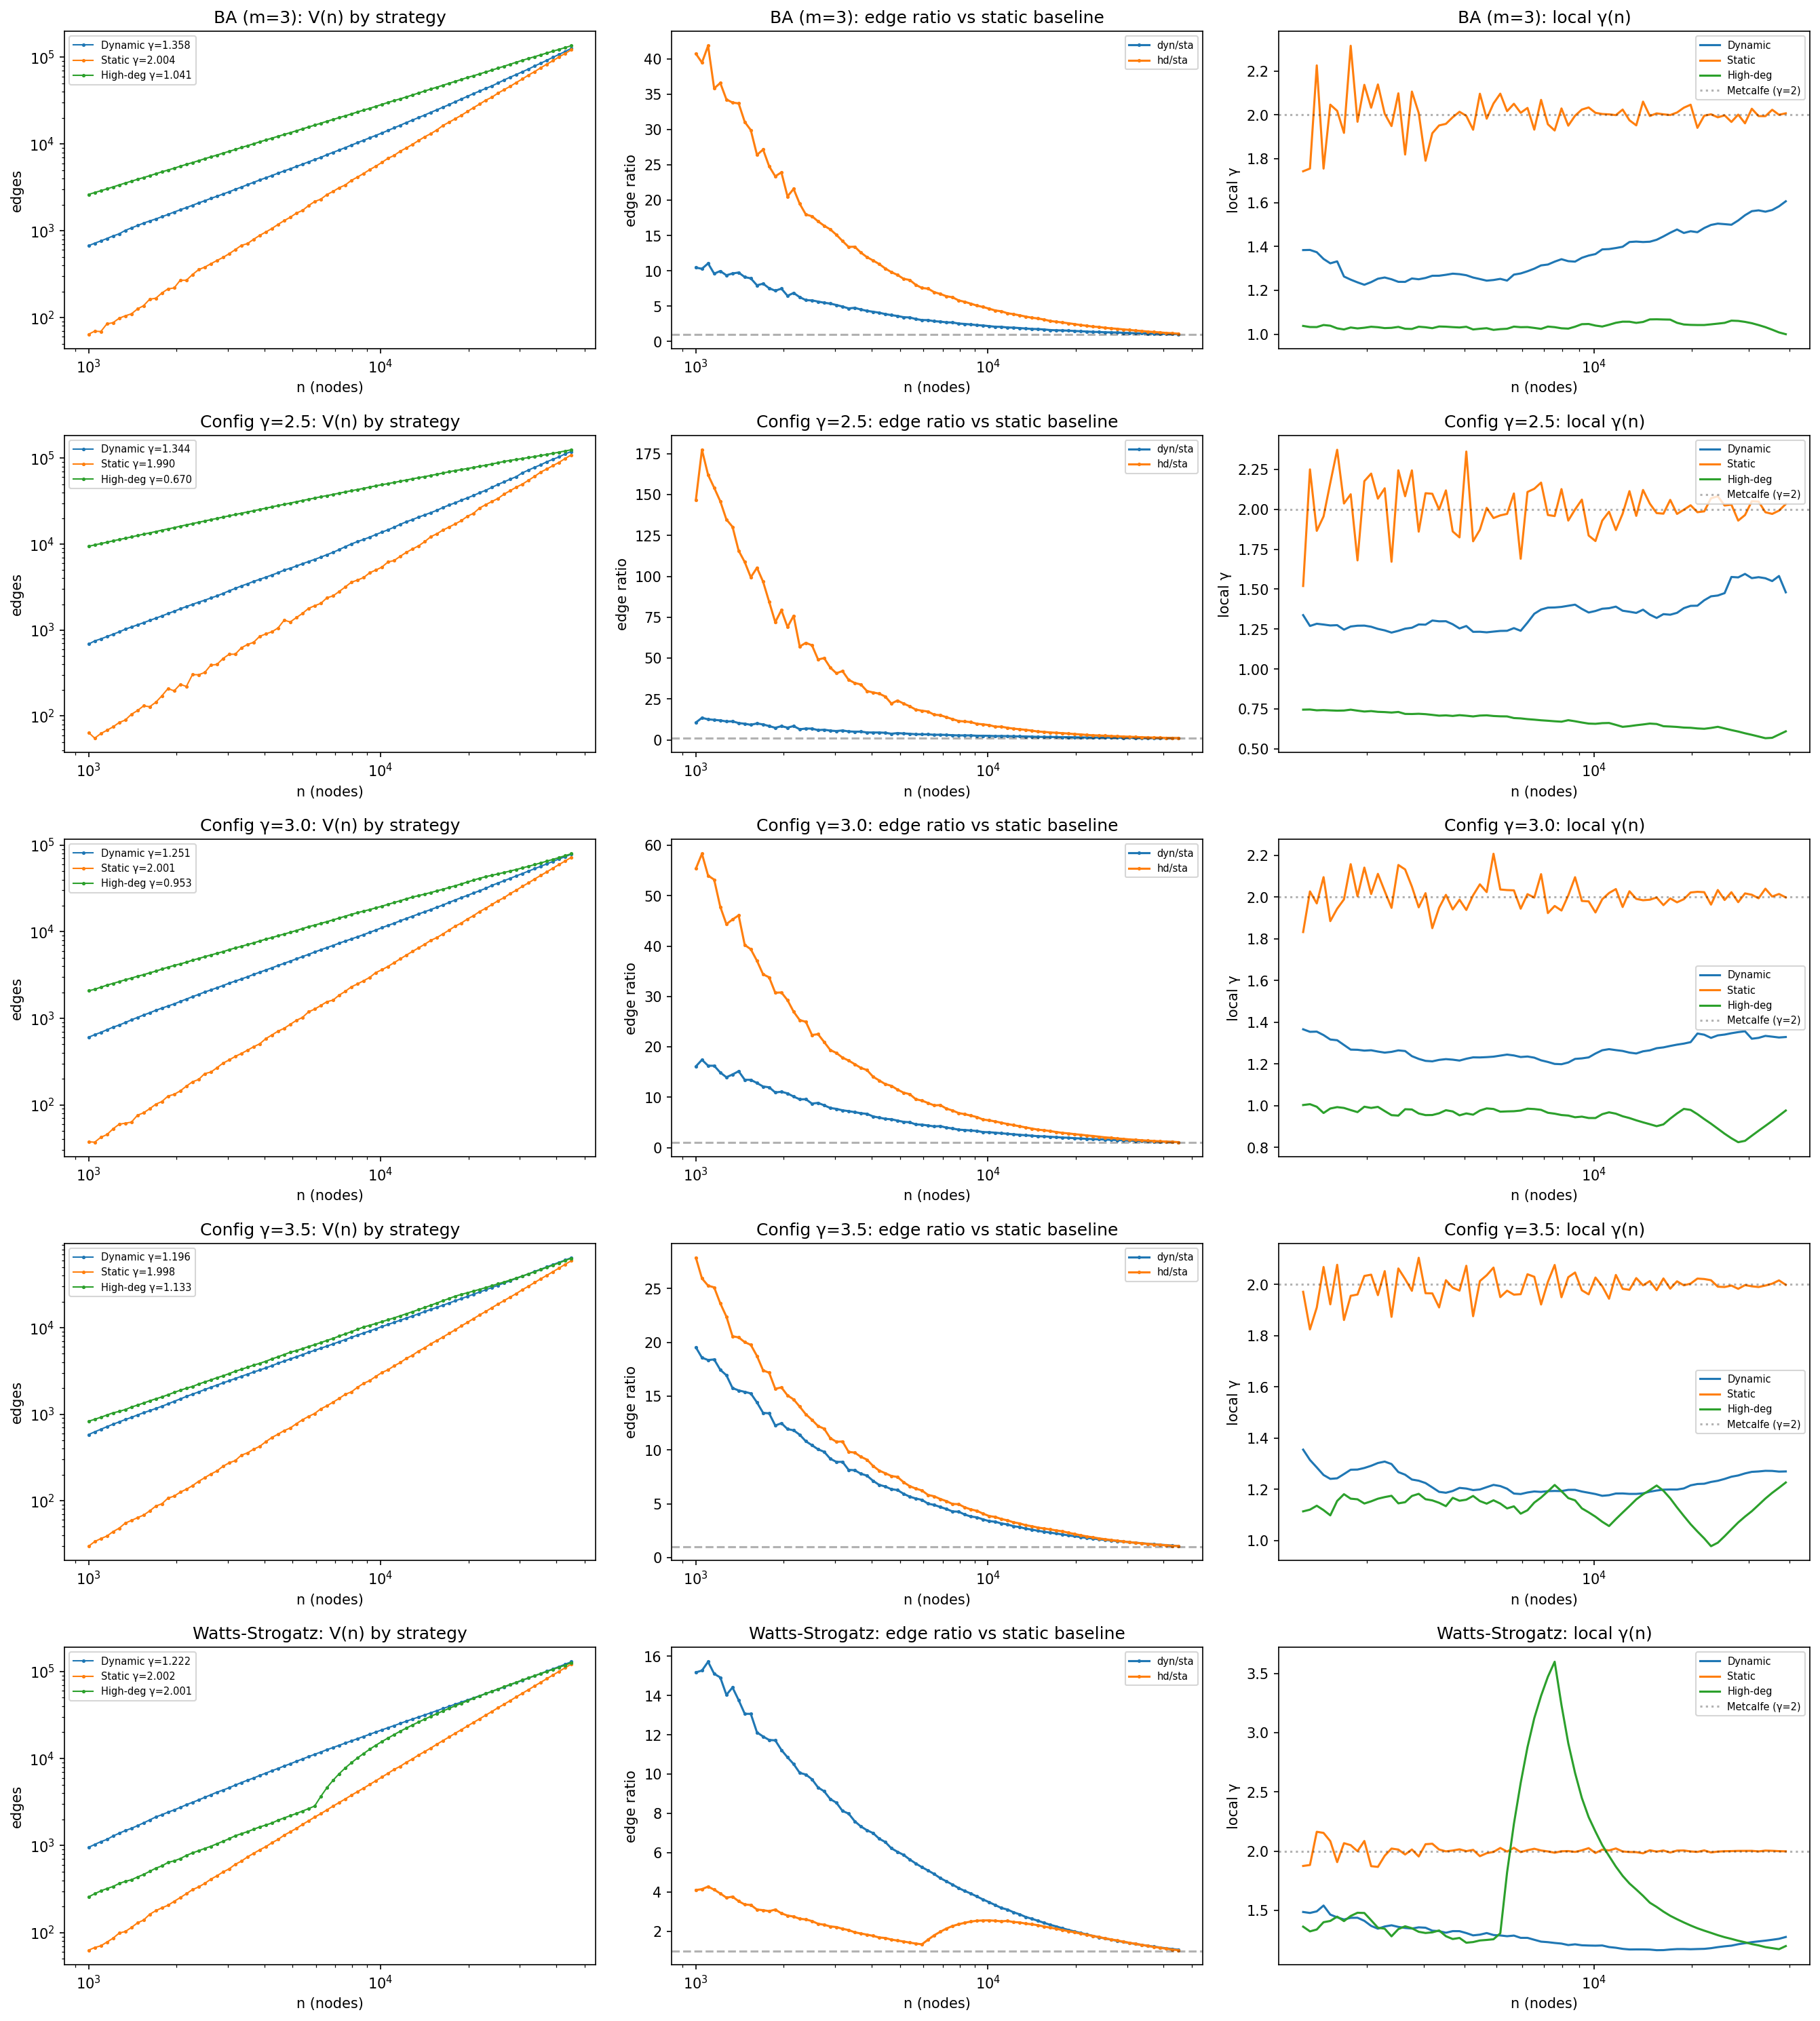
Dynamic vs static gamma figure
sim02 corroborative
Dynamic vs static gamma
Measuring value on the growing adopter set vs the final network changes gamma massively — the dynamic exponent is the right object.
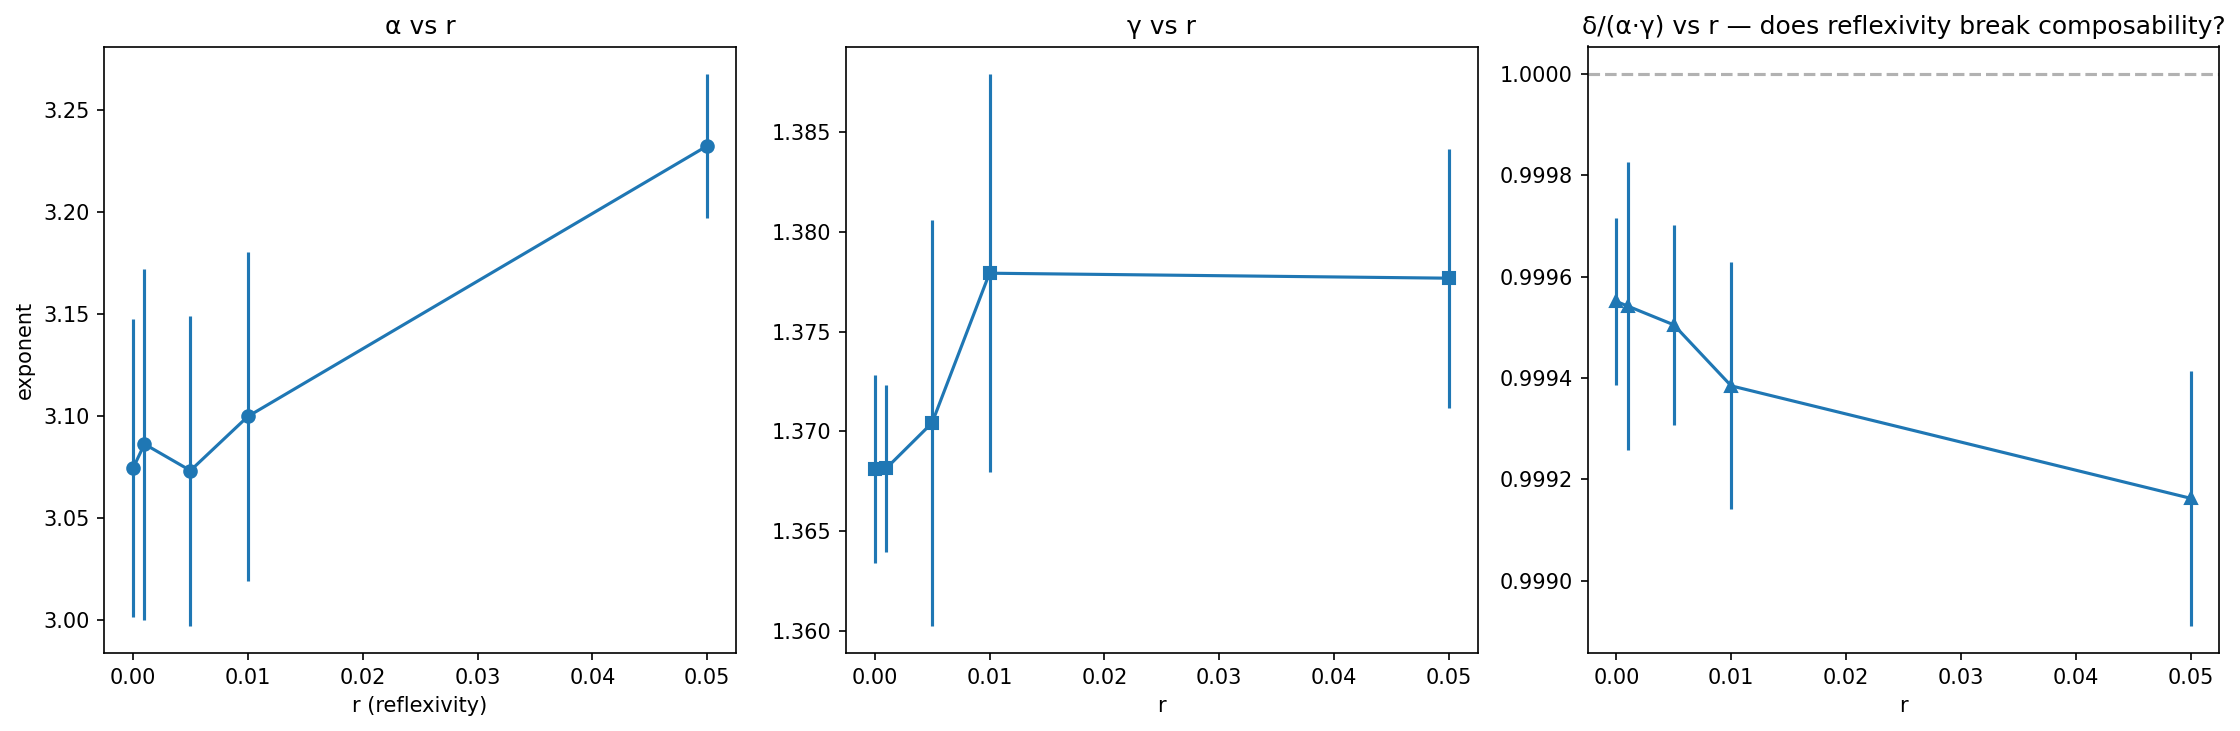
Reflexivity figure
sim03 corroborative
Reflexivity
Value-to-adoption feedback mostly changes speed, not exponents: composability survives.
Pareto weights: hubs = rich figure
sim04a corroborative
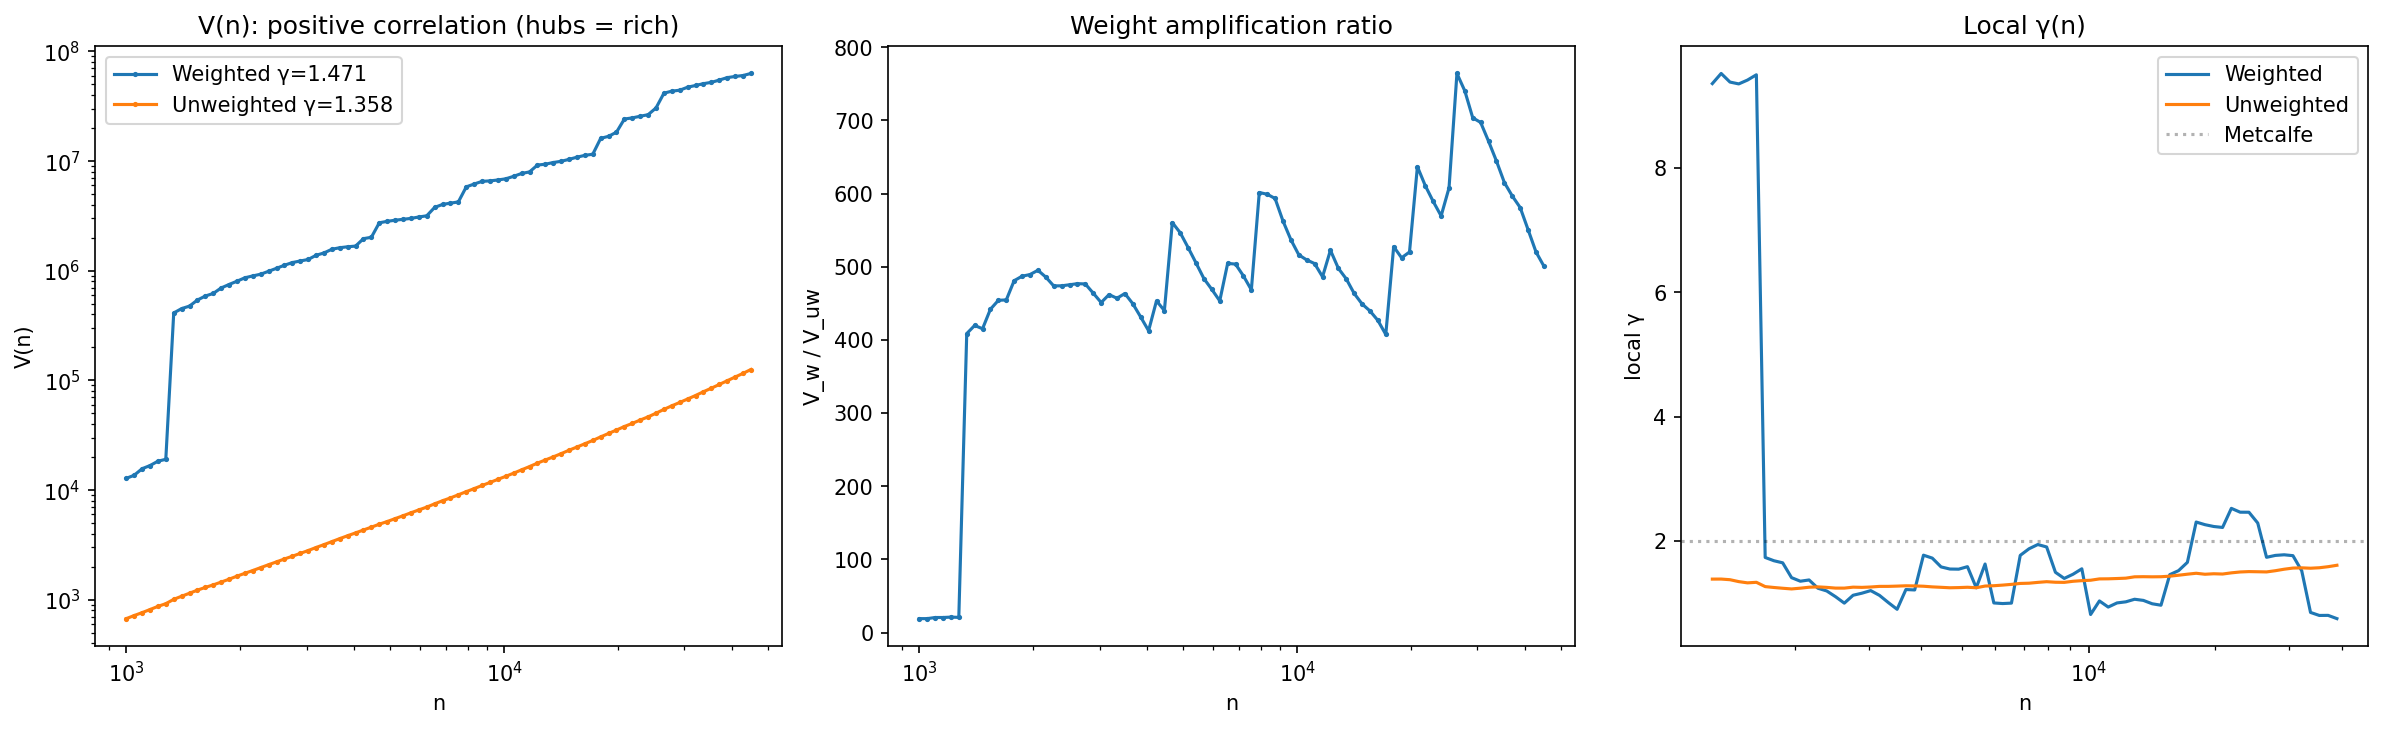
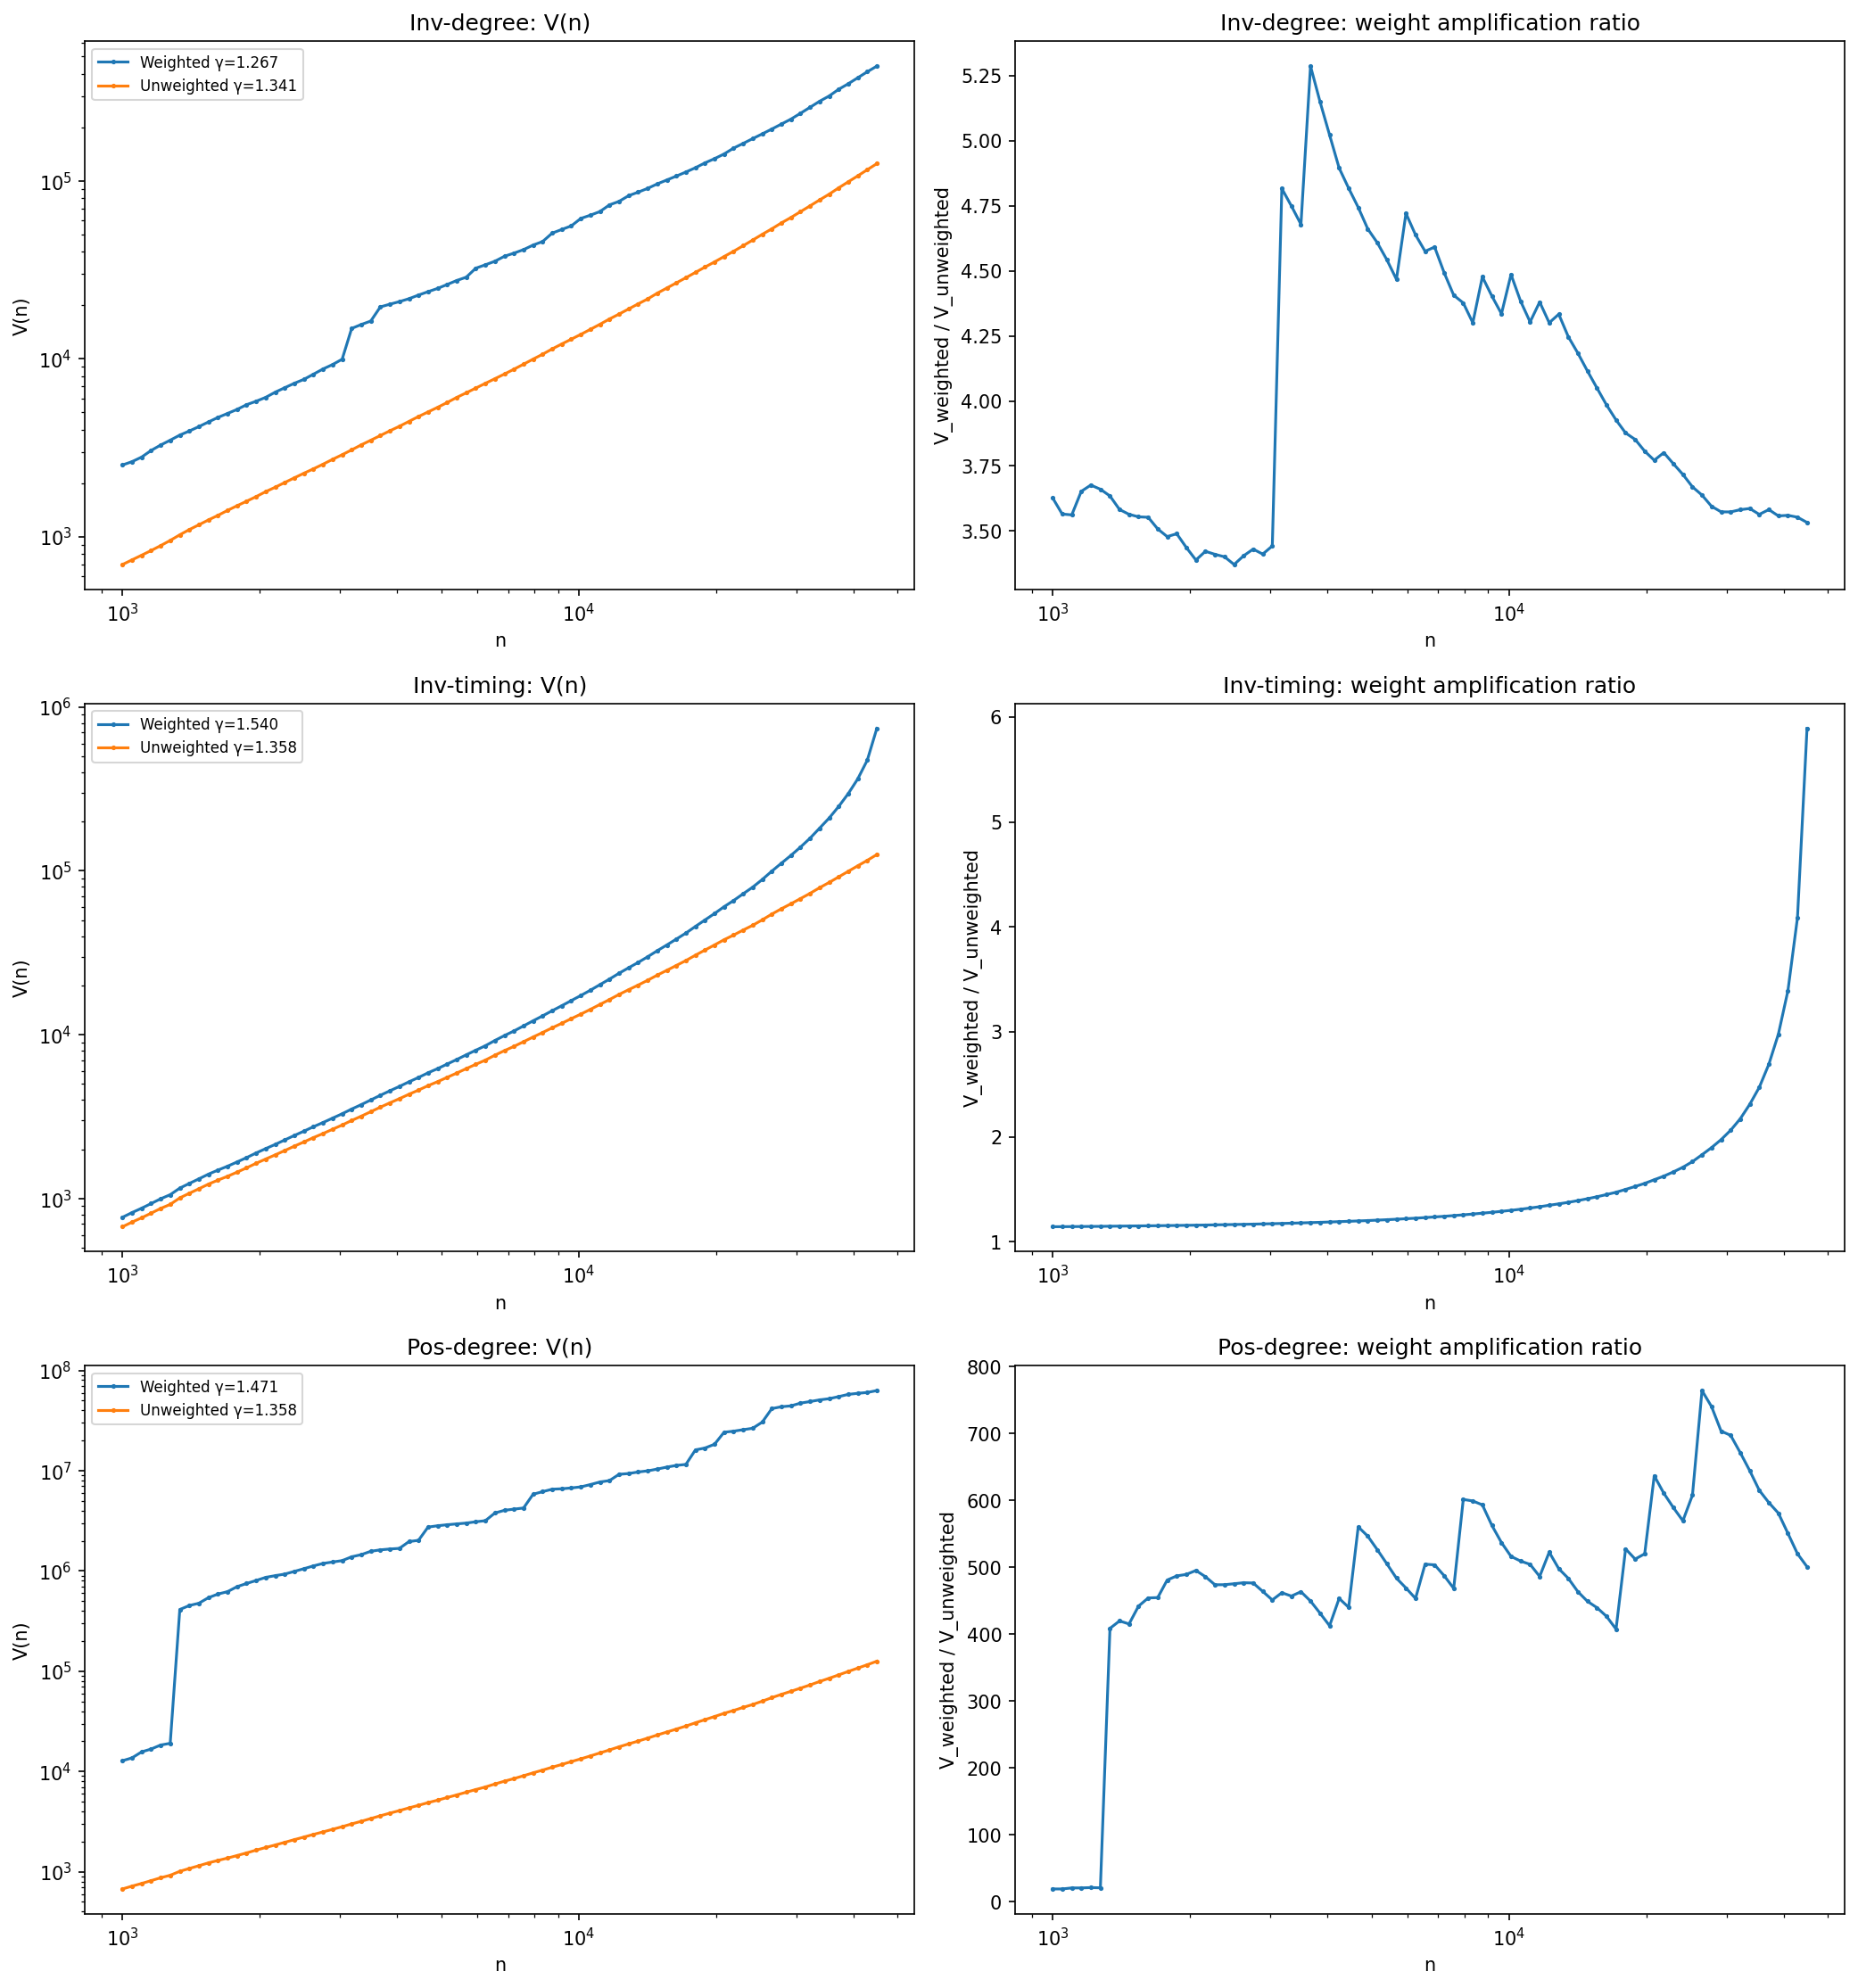
Pareto weights: hubs = rich
Wealth placed on network hubs: unstable and not very informative.
Pareto weights: late = rich figure
sim04b corroborative
Pareto weights: late = rich
Wealth arriving late raises gamma in a stable, significant way.
Sequential strata figure
sim04c corroborative
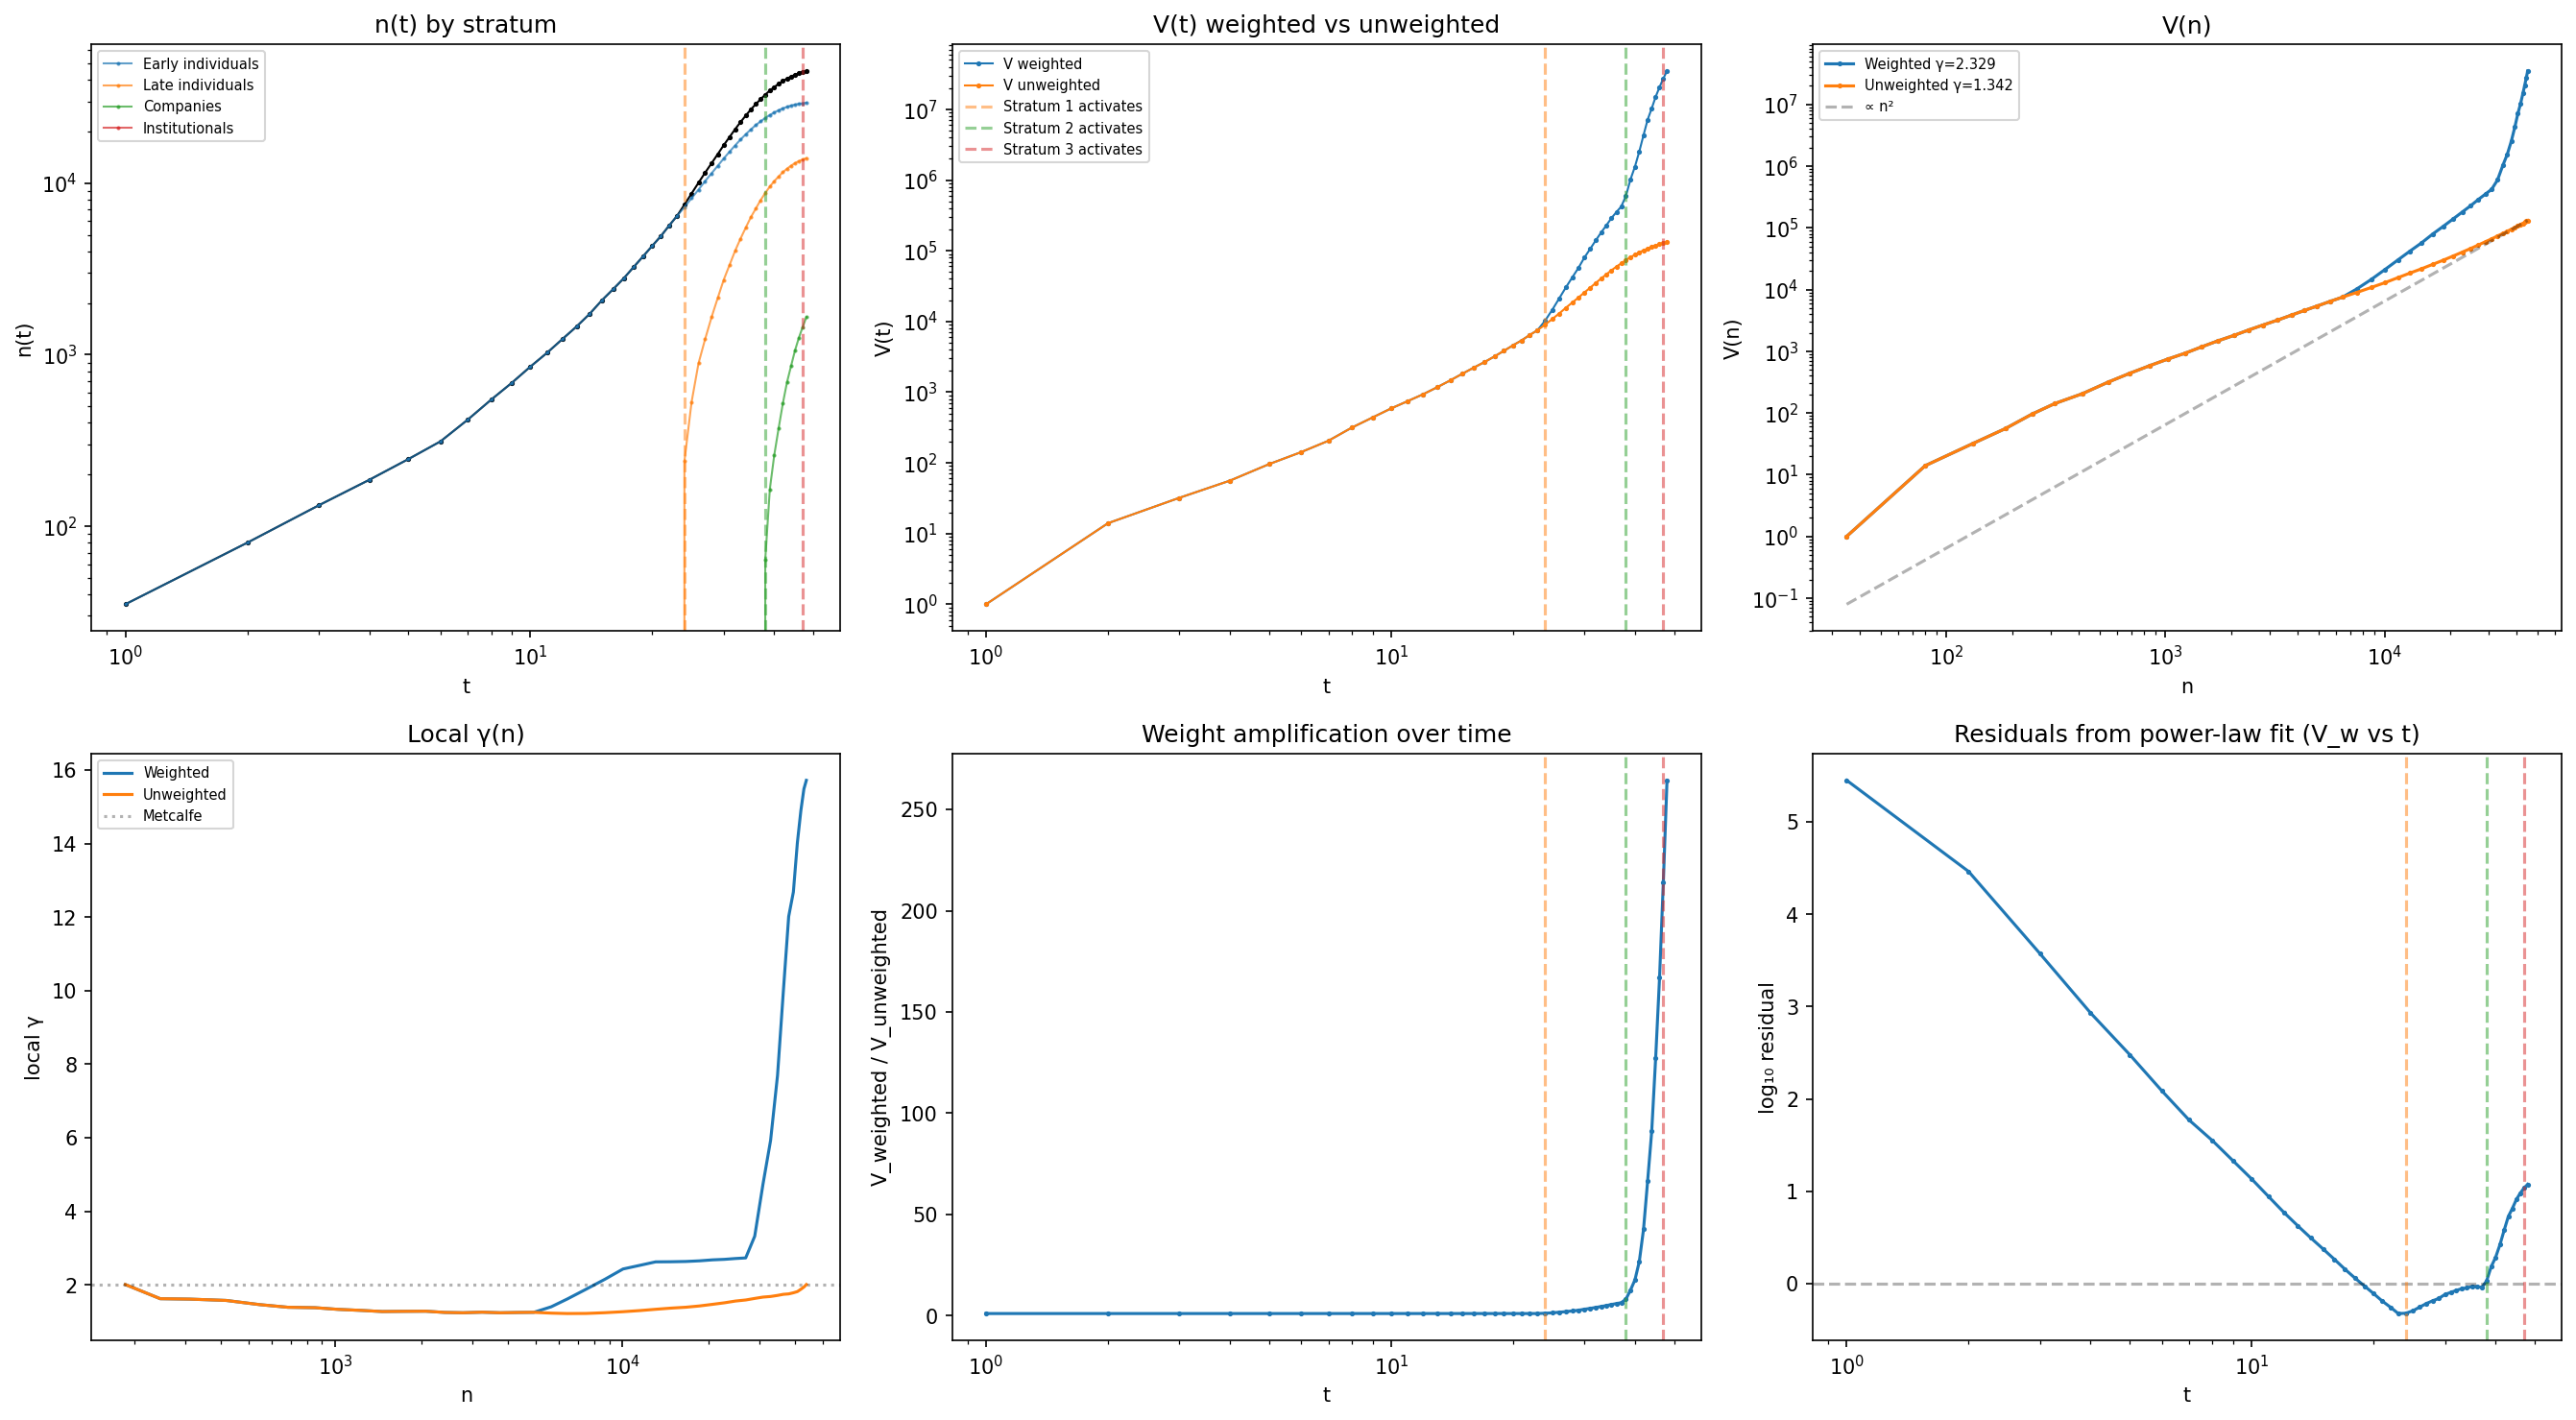
Sequential strata
Stratified activation is the most powerful mechanism tested: gamma_weighted = 2.33.
Where is alpha = 3? figure
sim05 corroborative
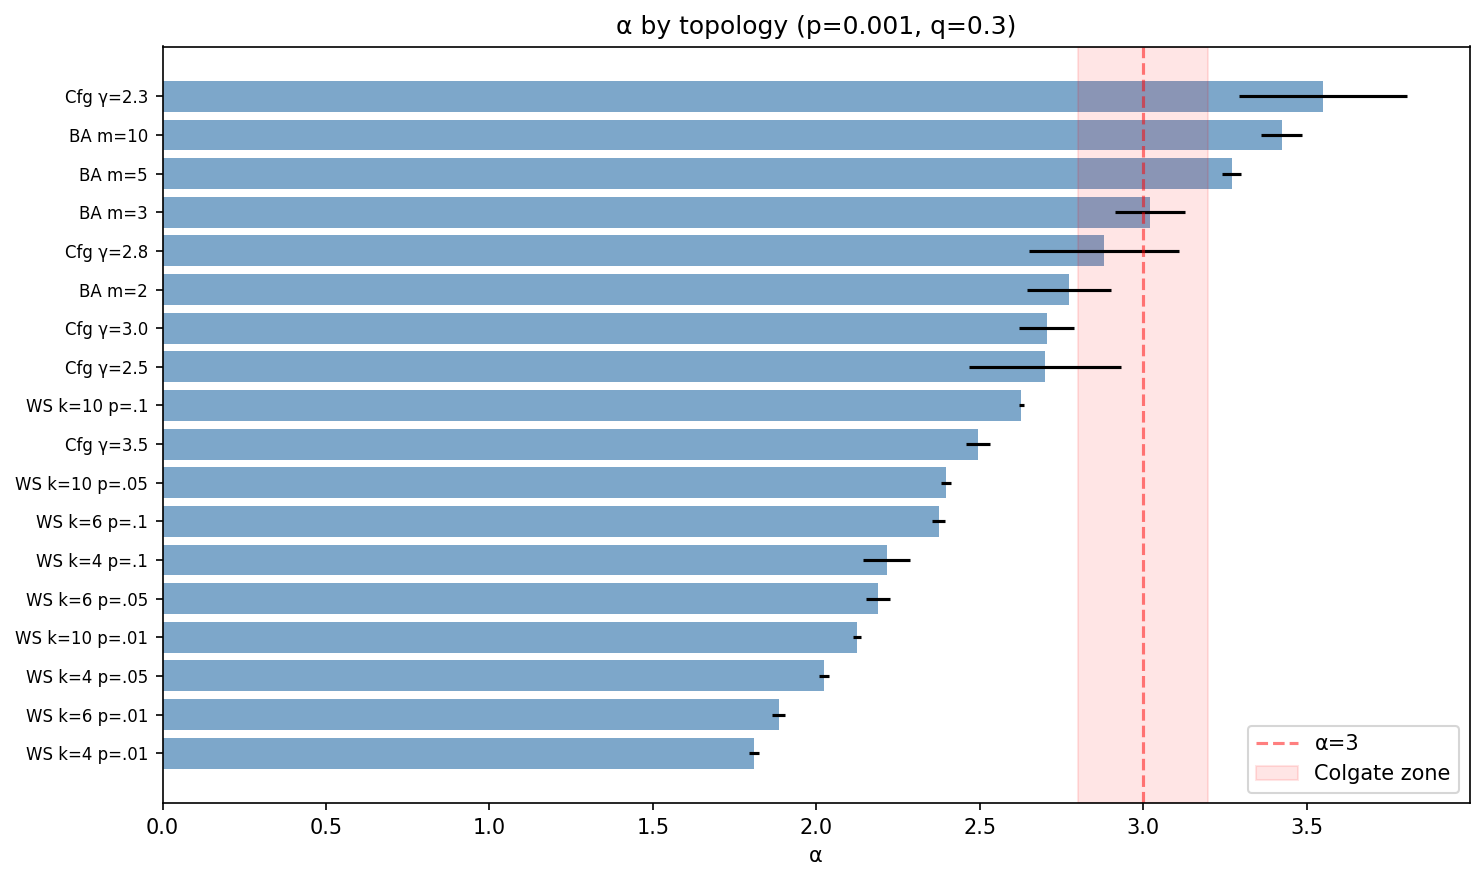
Where is alpha = 3?
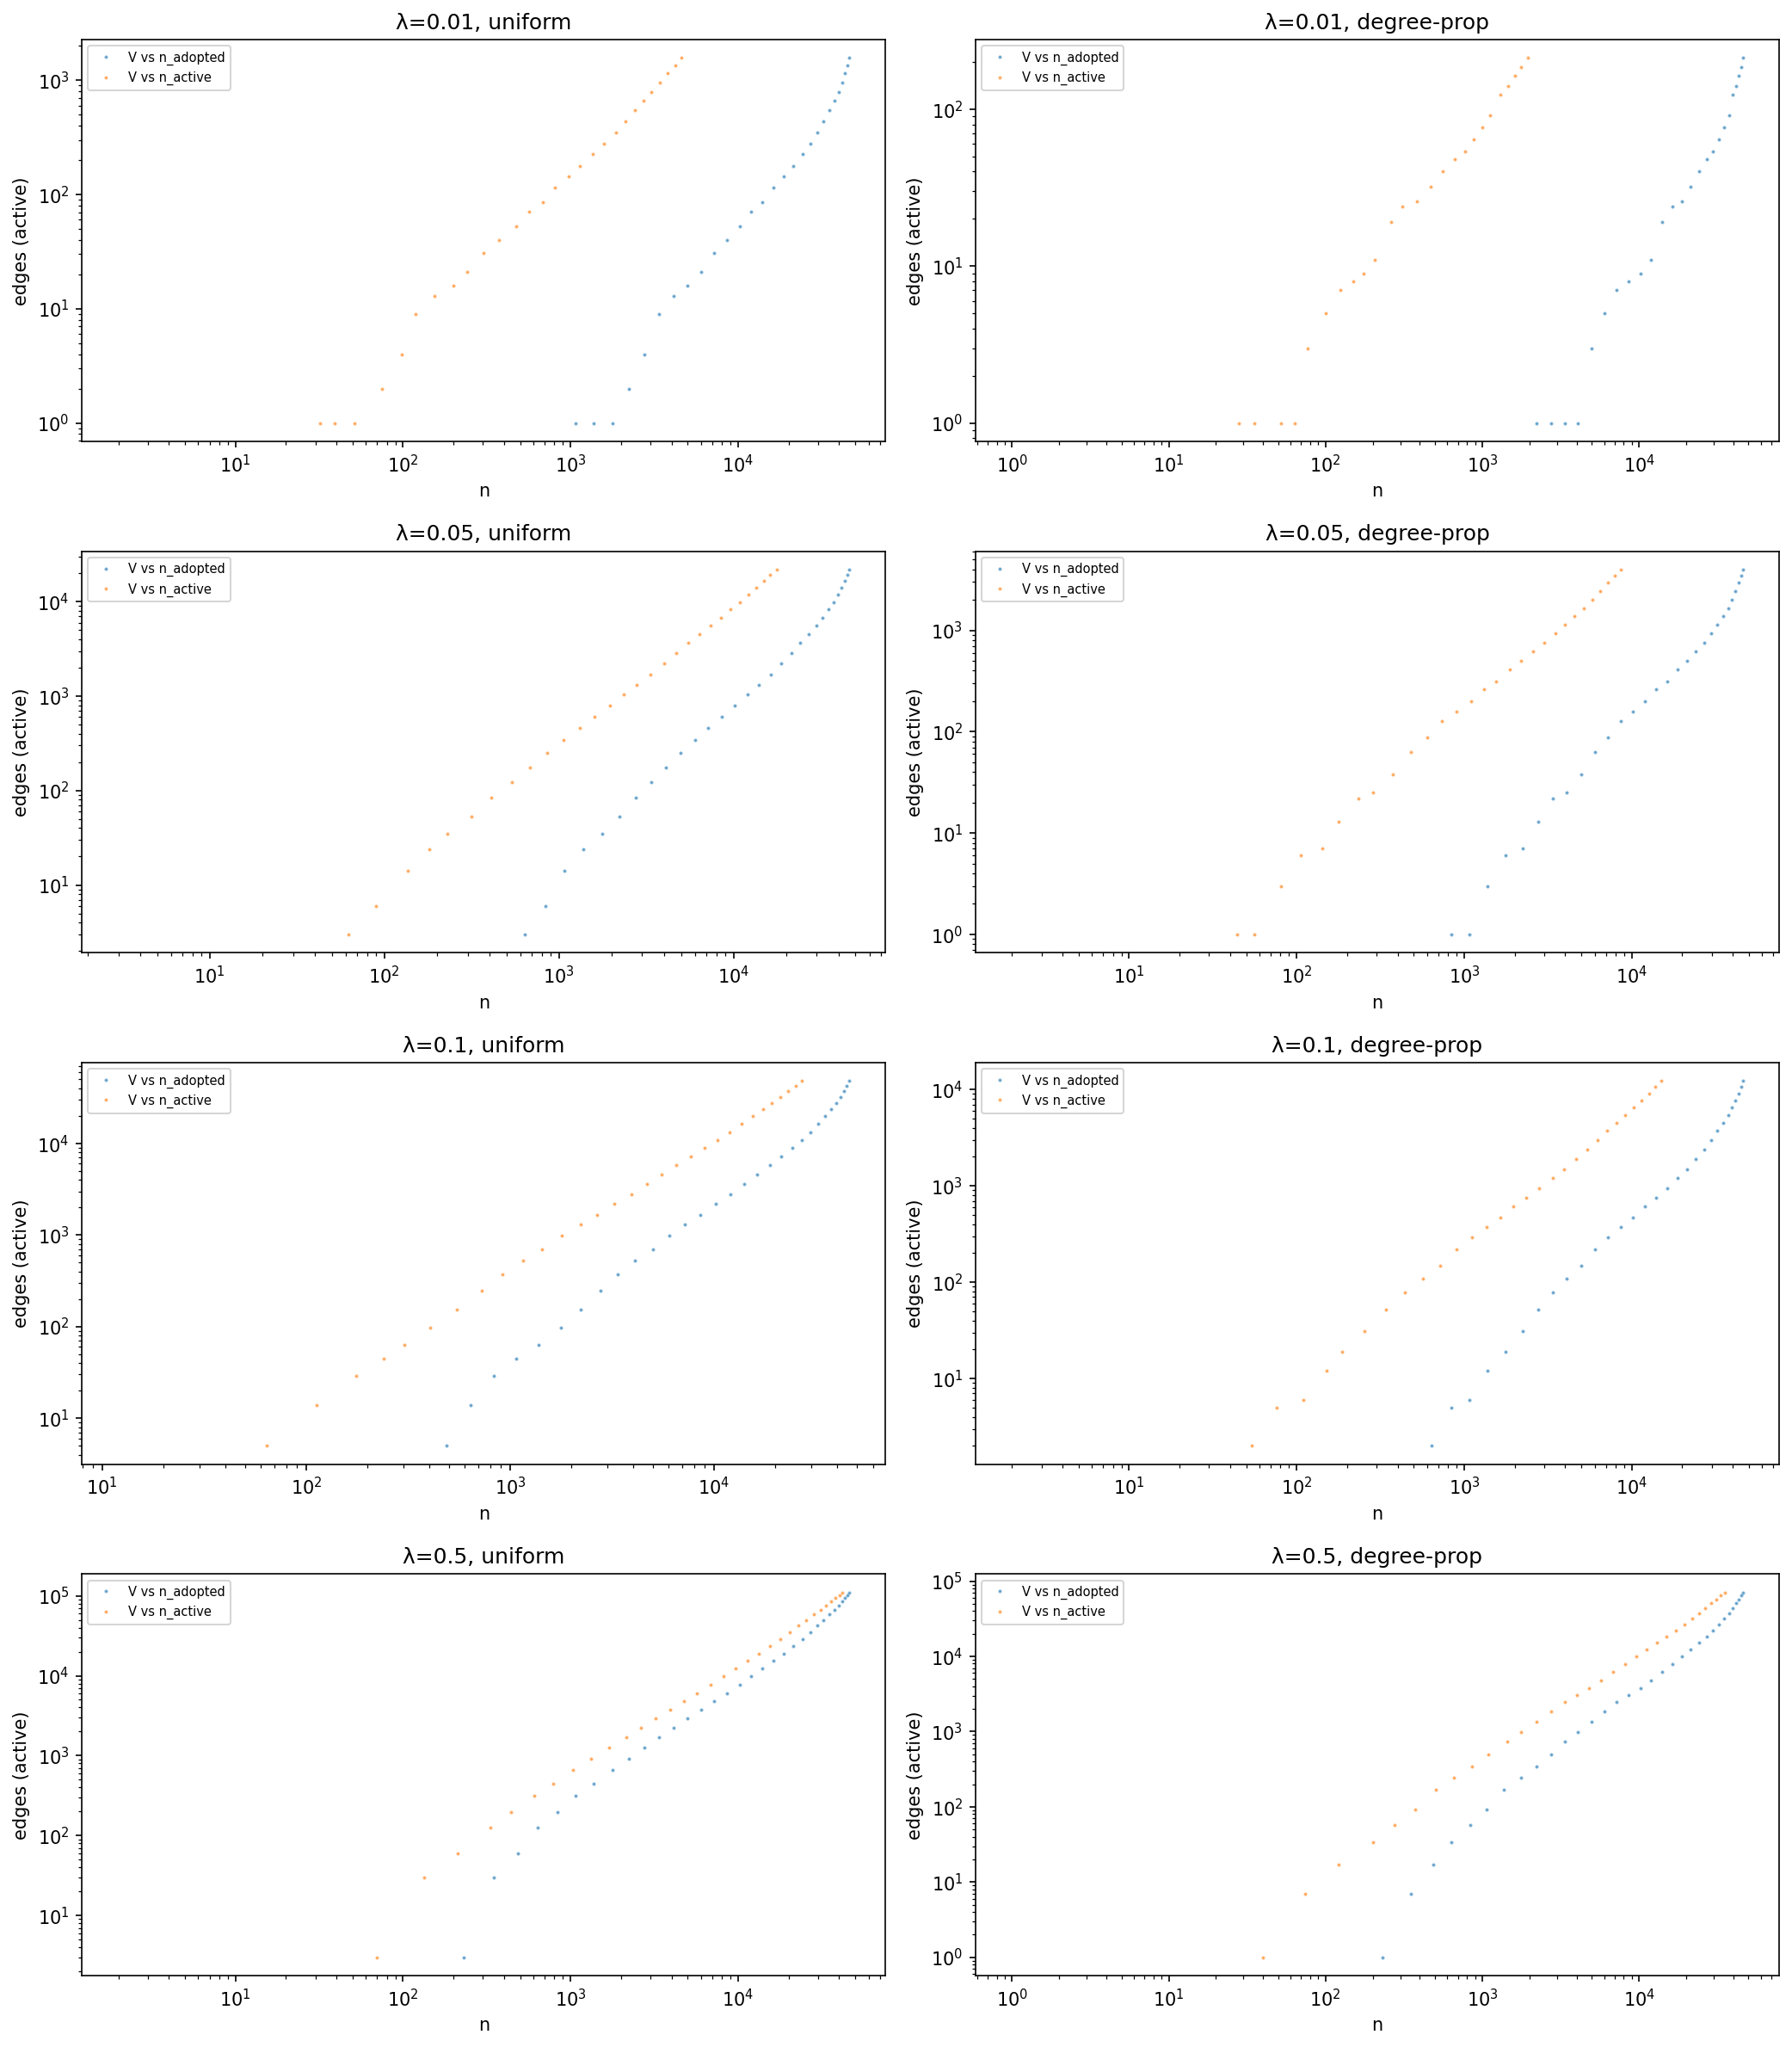
Only 8.1% of the topology grid yields alpha in [2.8, 3.2] — a moderate basin, not a universal attractor.
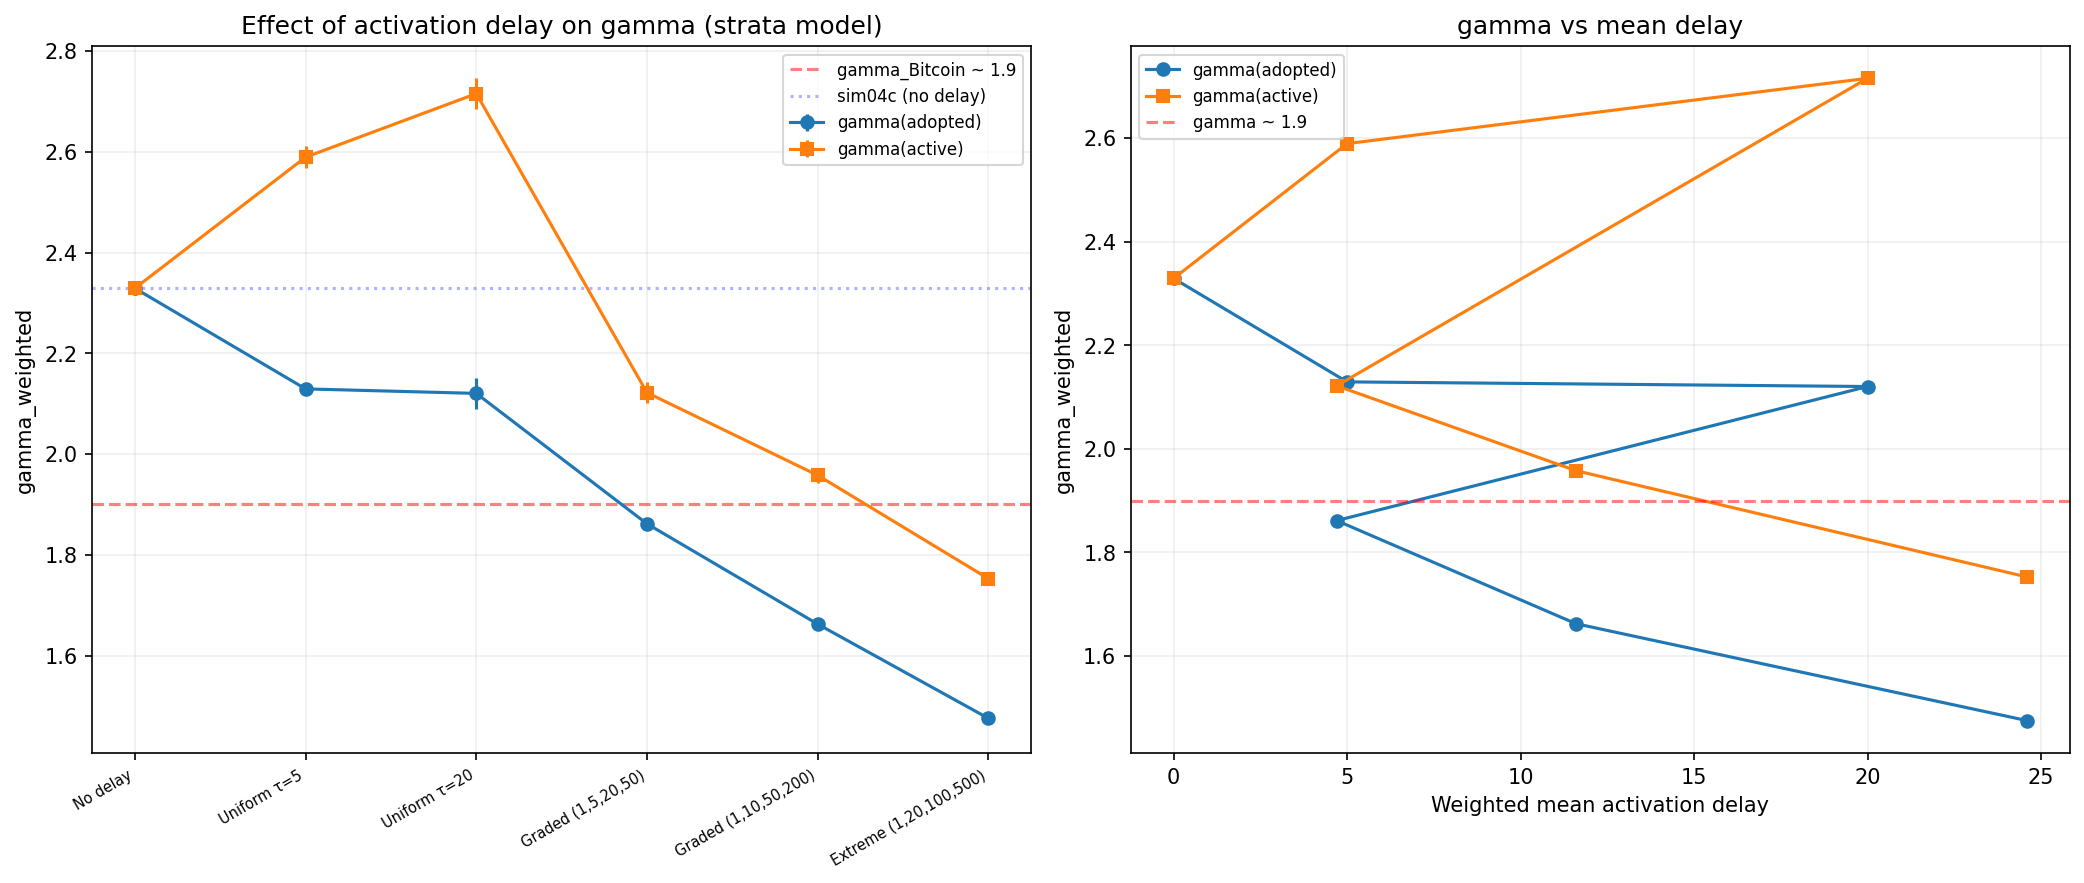
Delayed activation figure
sim06 corroborative
Delayed activation
Adoption is not value creation: activation delay significantly raises the measured gamma.
Churn figure
sim07 corroborative
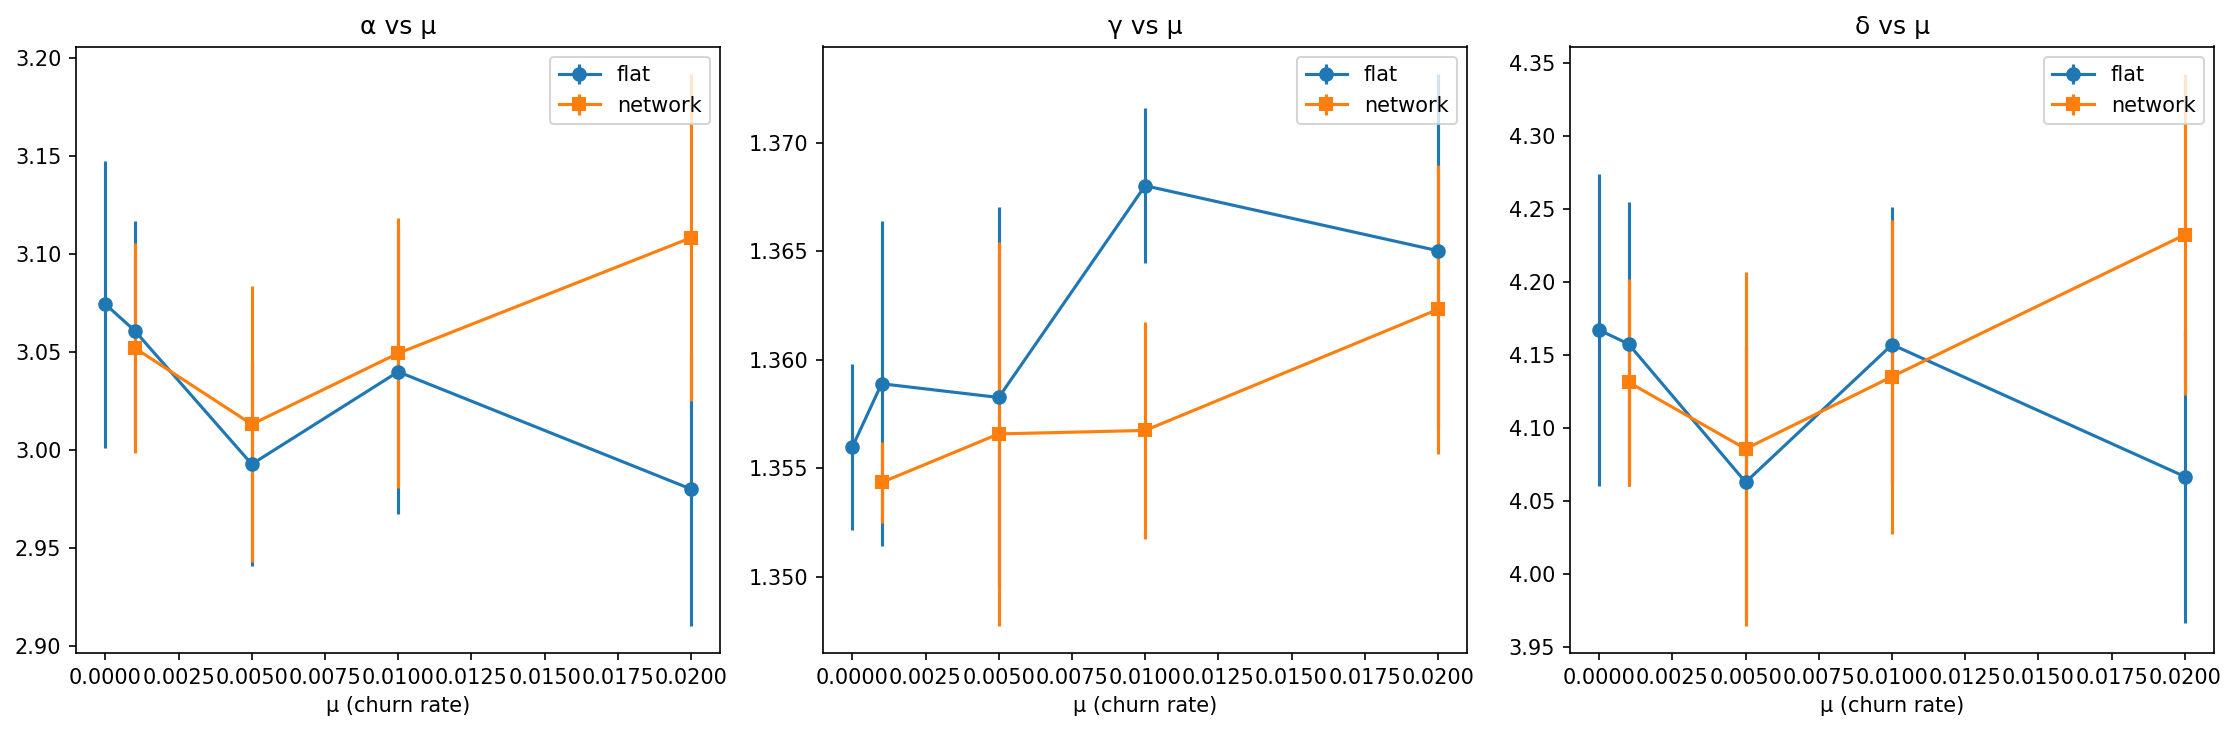
Churn
De-adoption barely moves the exponents — the law is robust to churn.
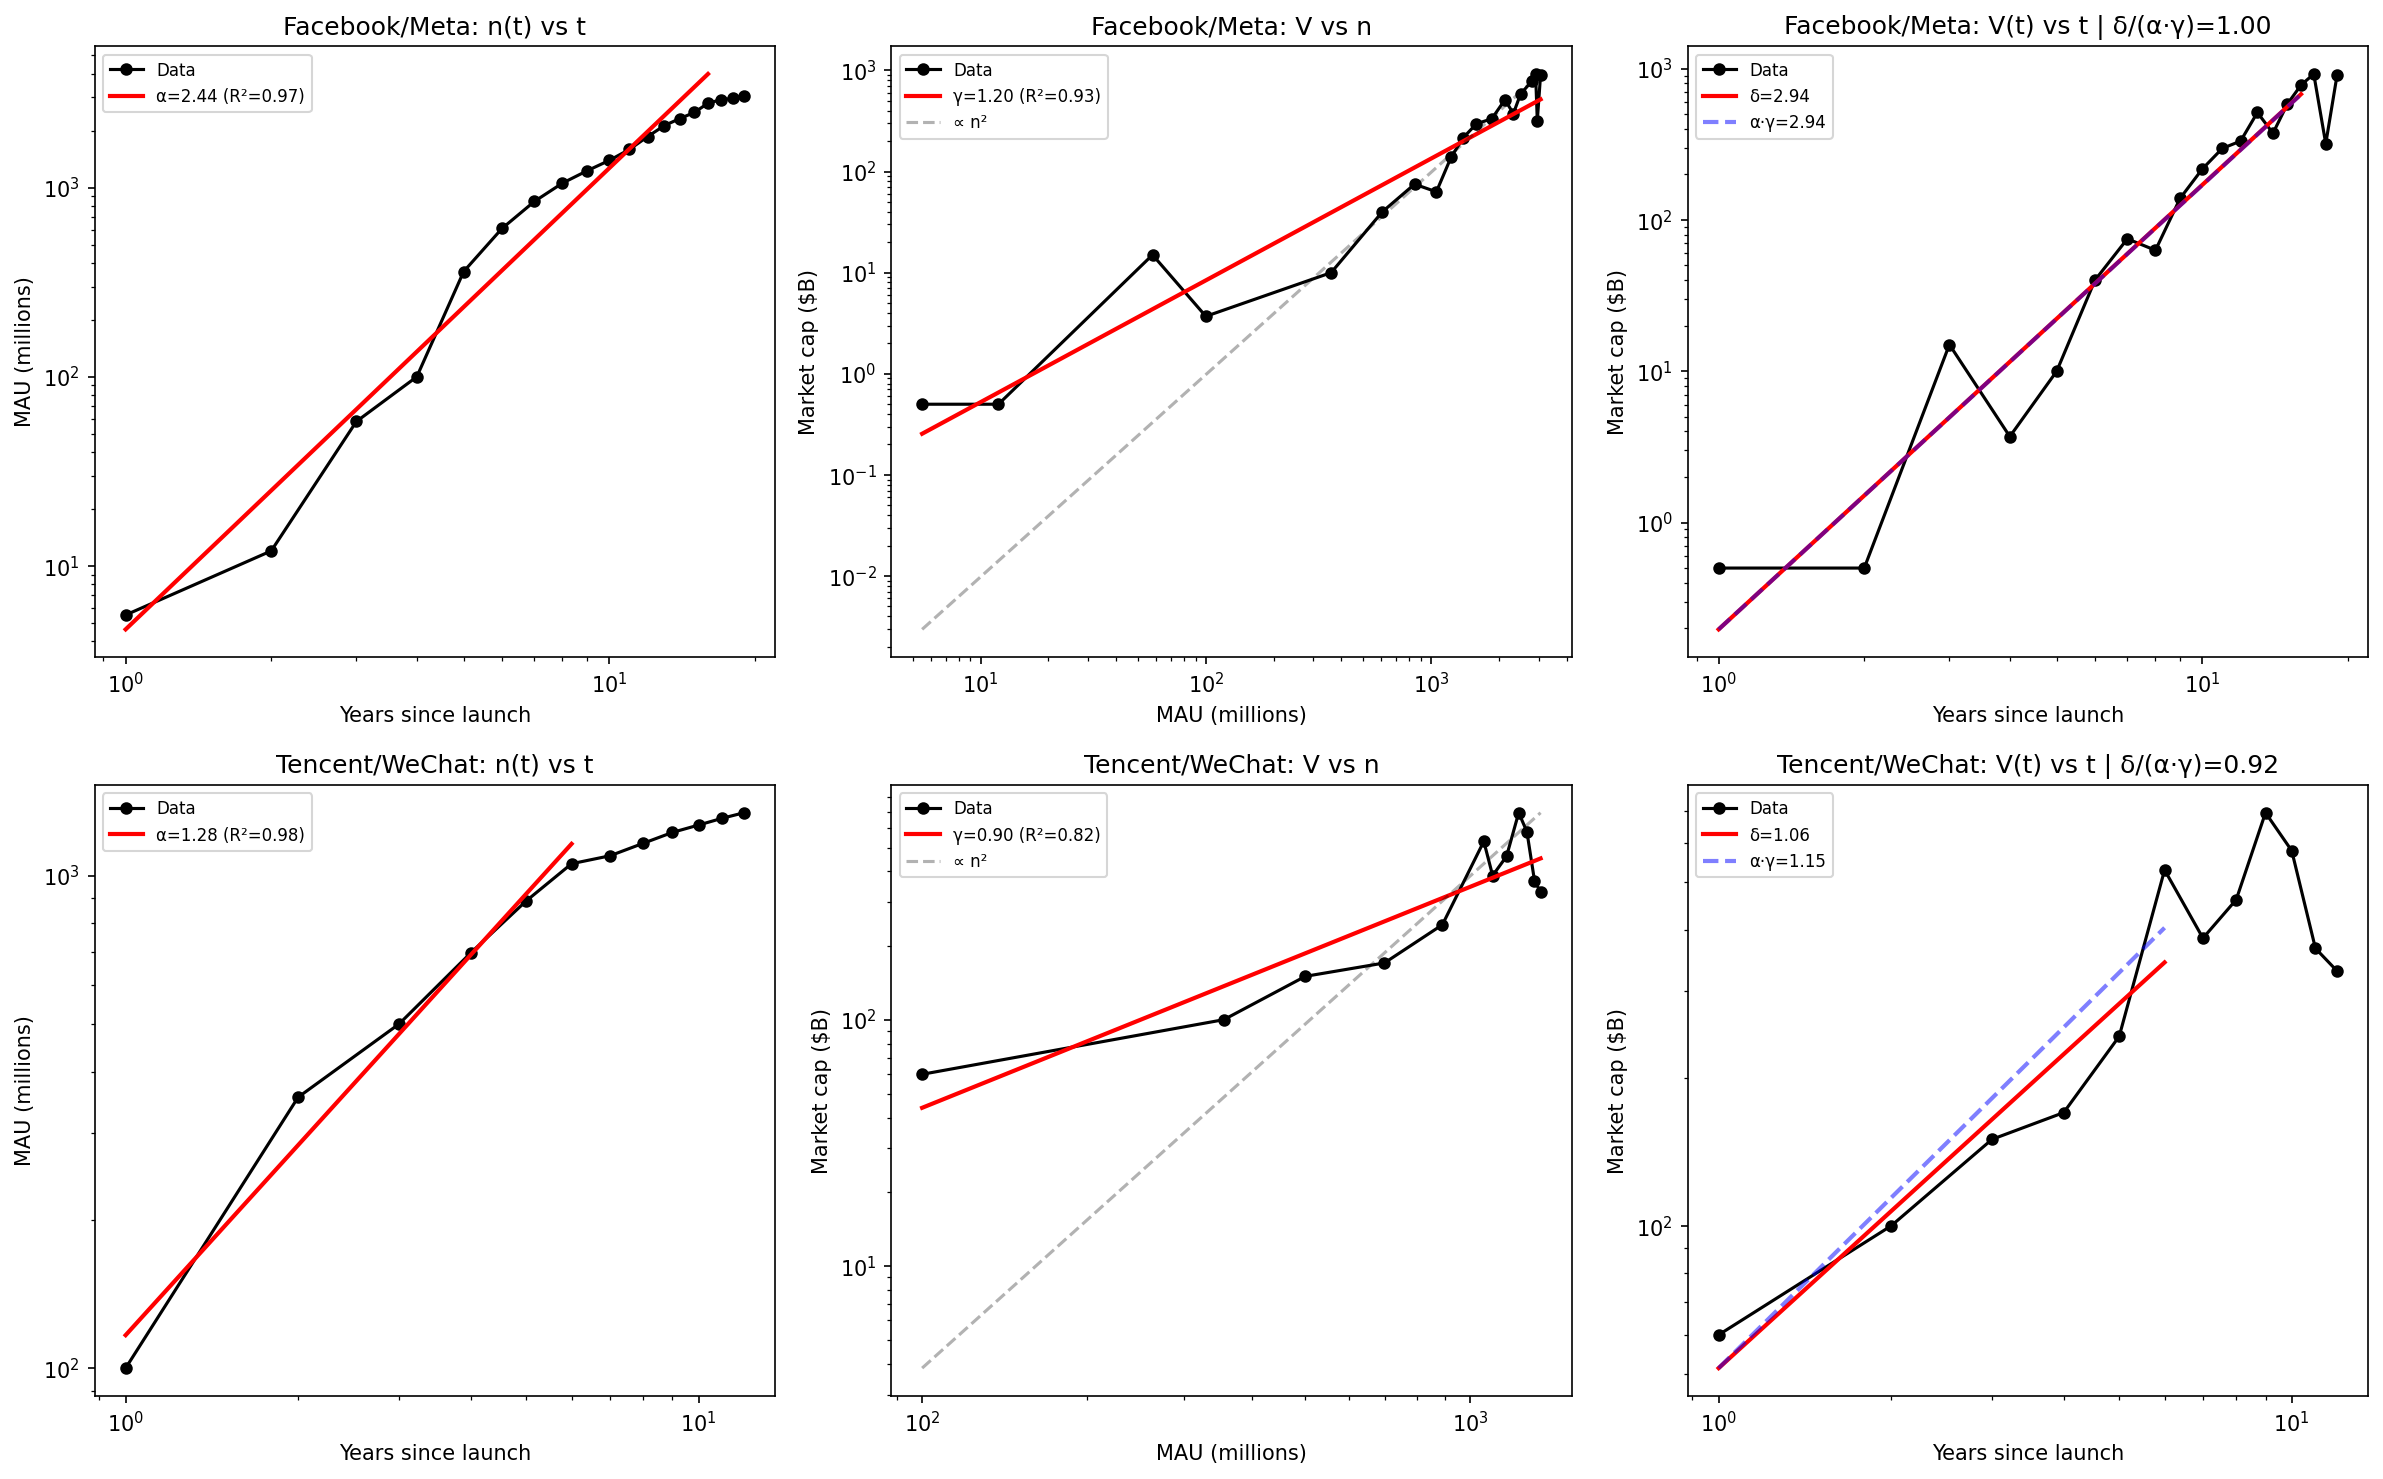
Facebook/Tencent control figure
sim08 corroborative
Facebook/Tencent control
Real networks with known data: Facebook validates the framework exactly (gamma 1.20); Tencent deviates.
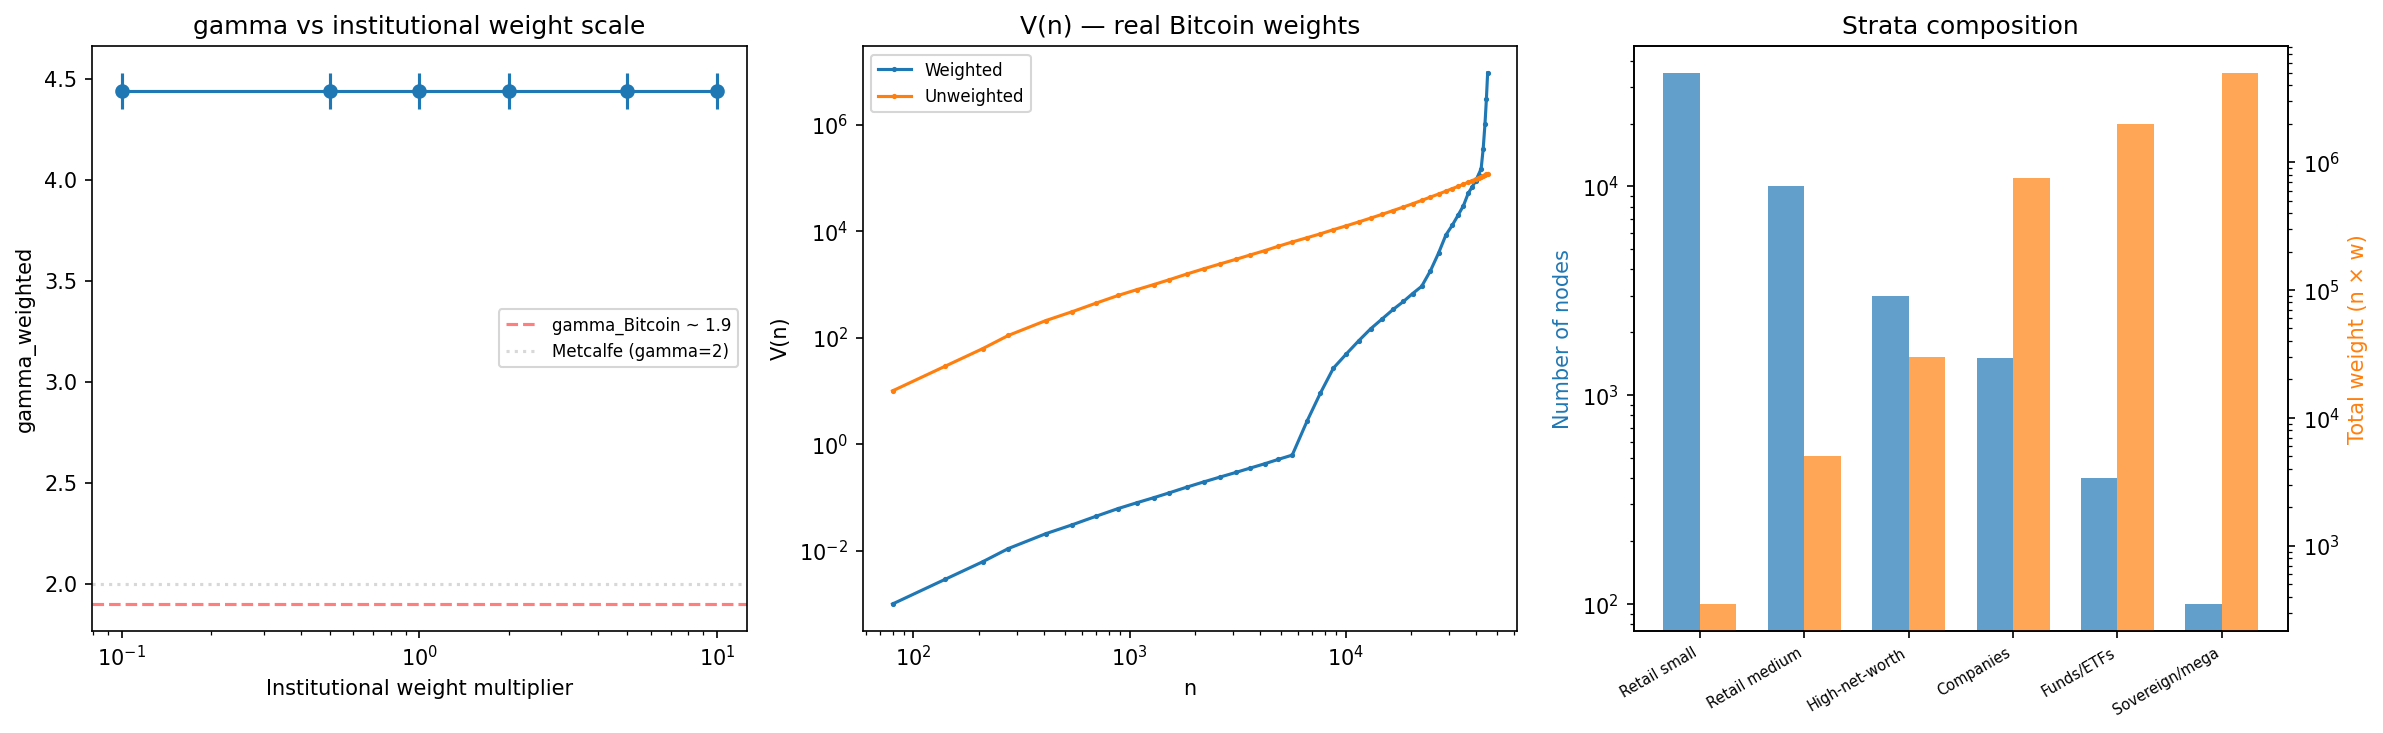
Real Bitcoin weights figure
sim09 corroborative
Real Bitcoin weights
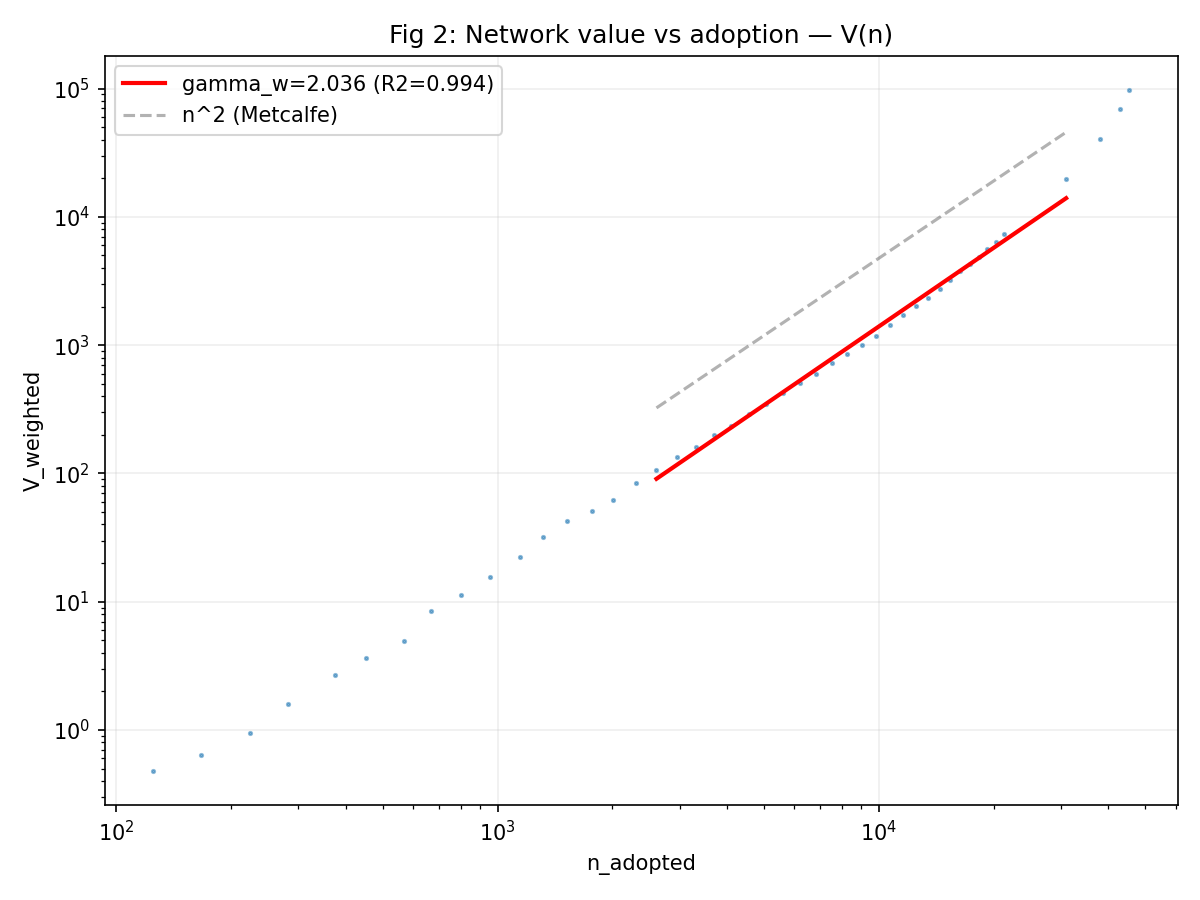
Naive V = sum(w*w) with real weights gives gamma = 4.44 — far too high; motivated the sublinear value function (sim17).
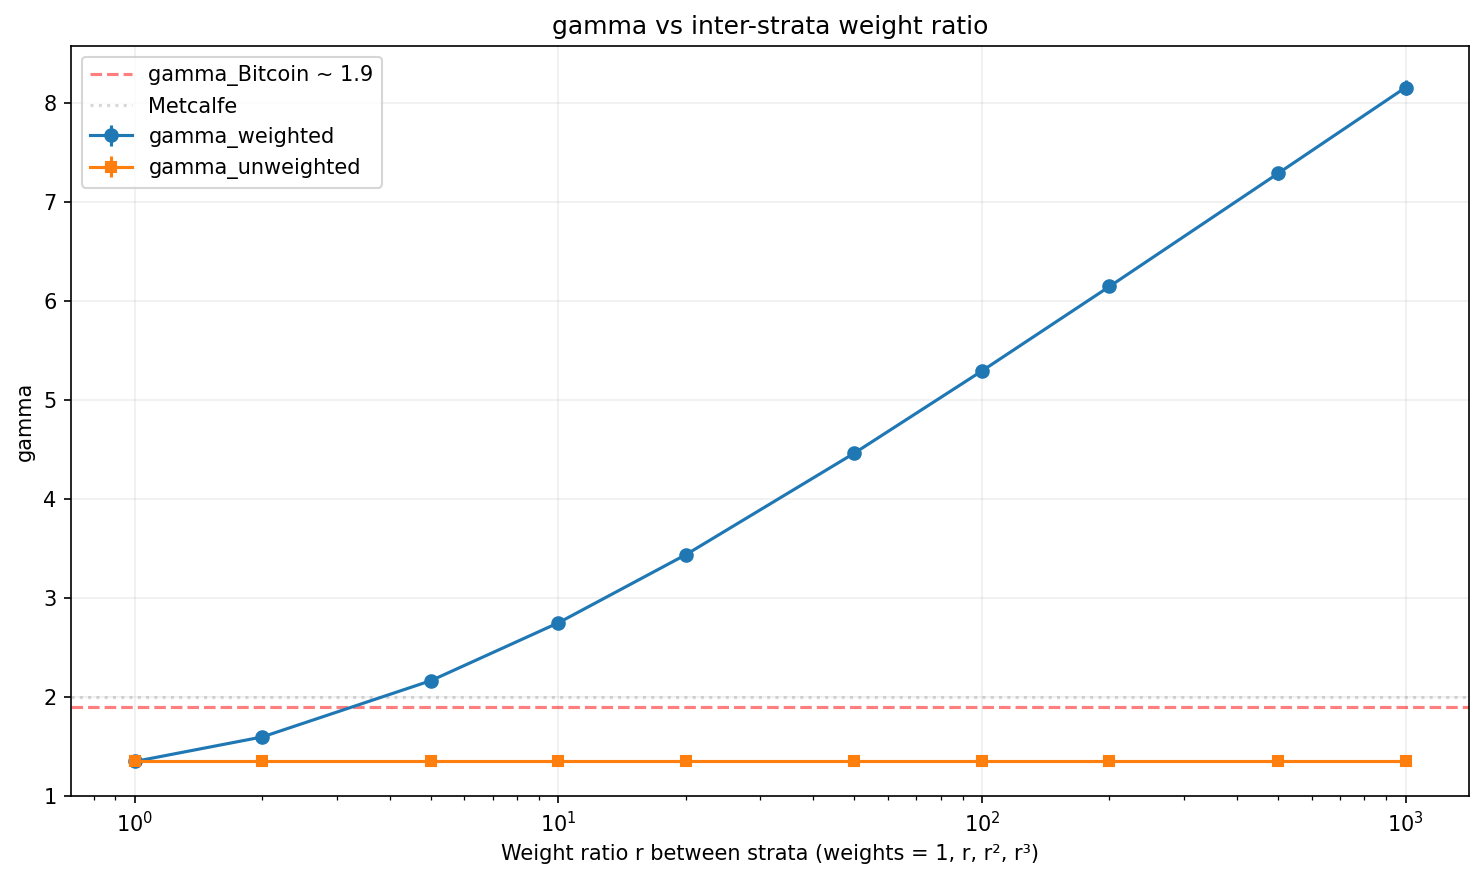
Weight ratio sweep figure
sim11 corroborative
Weight ratio sweep
gamma = 1.9 corresponds to inter-stratum weight ratios r = 3-4.
Delay + strata figure
sim13 corroborative
Delay + strata
The graded delay profile gives gamma(adopted) = 1.86 — close to Bitcoin's 1.9.
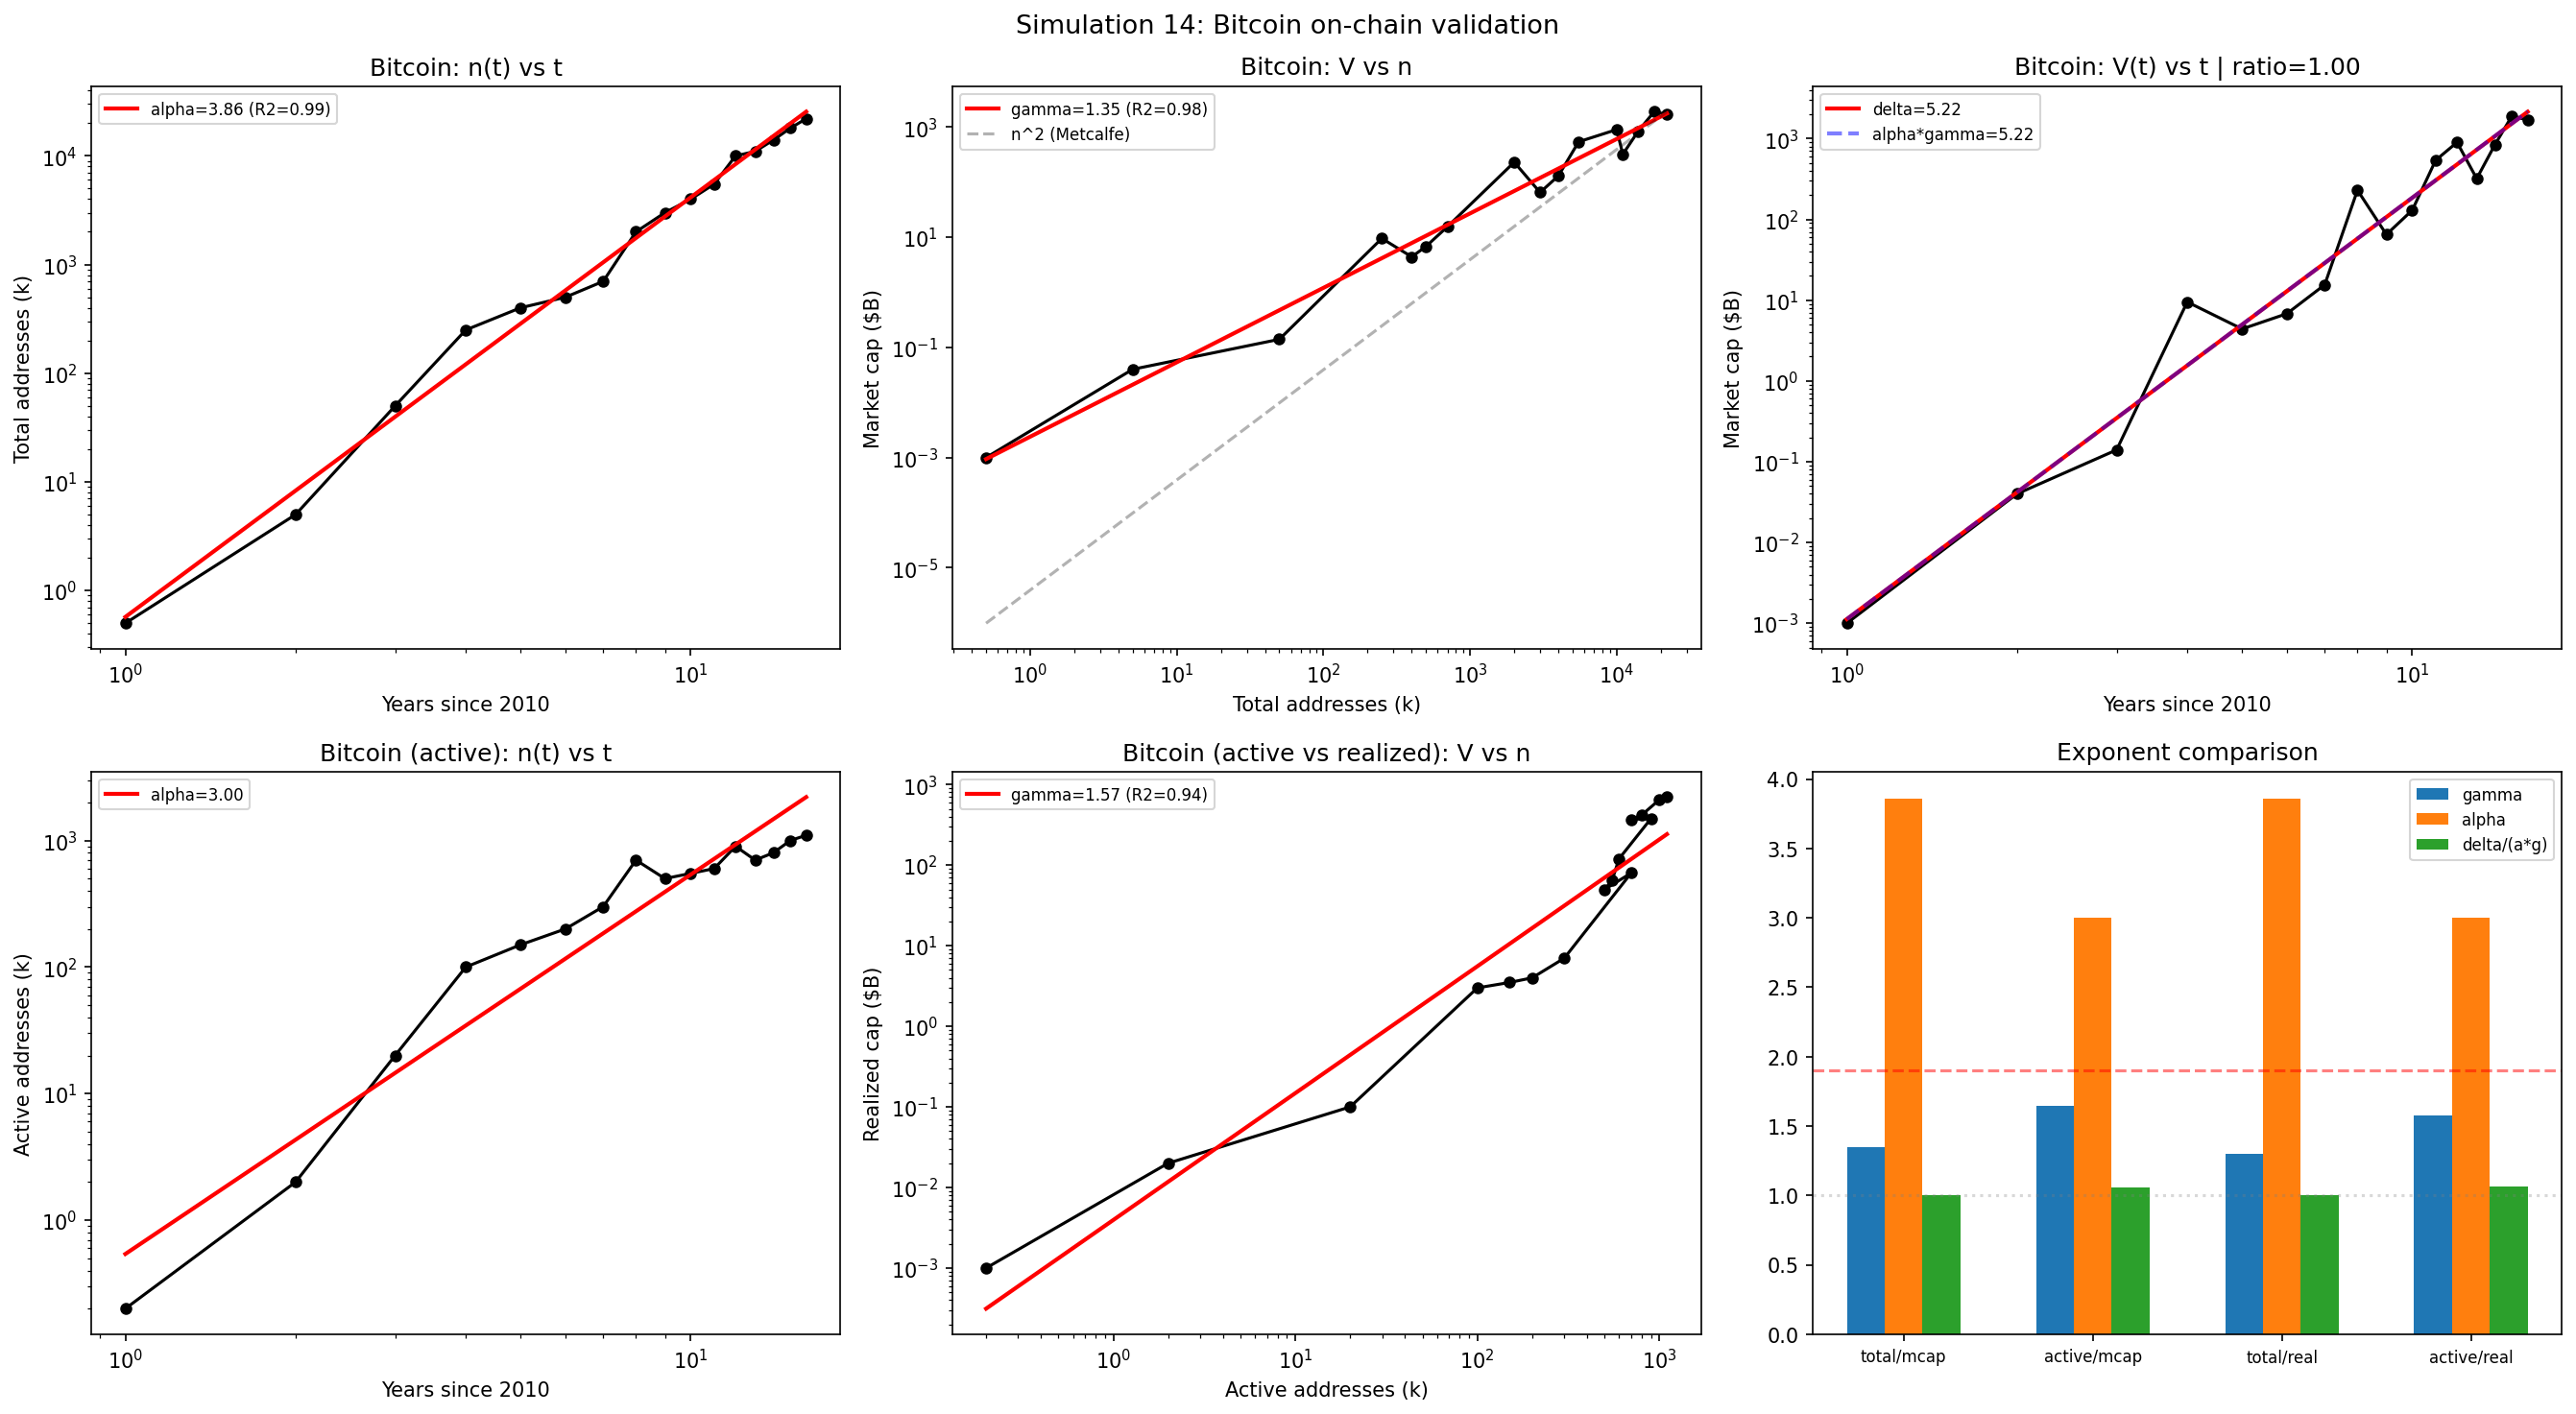
Bitcoin on-chain validation figure
sim14 corroborative
Bitcoin on-chain validation
The framework reproduces Bitcoin's own on-chain exponents, especially with total addresses.
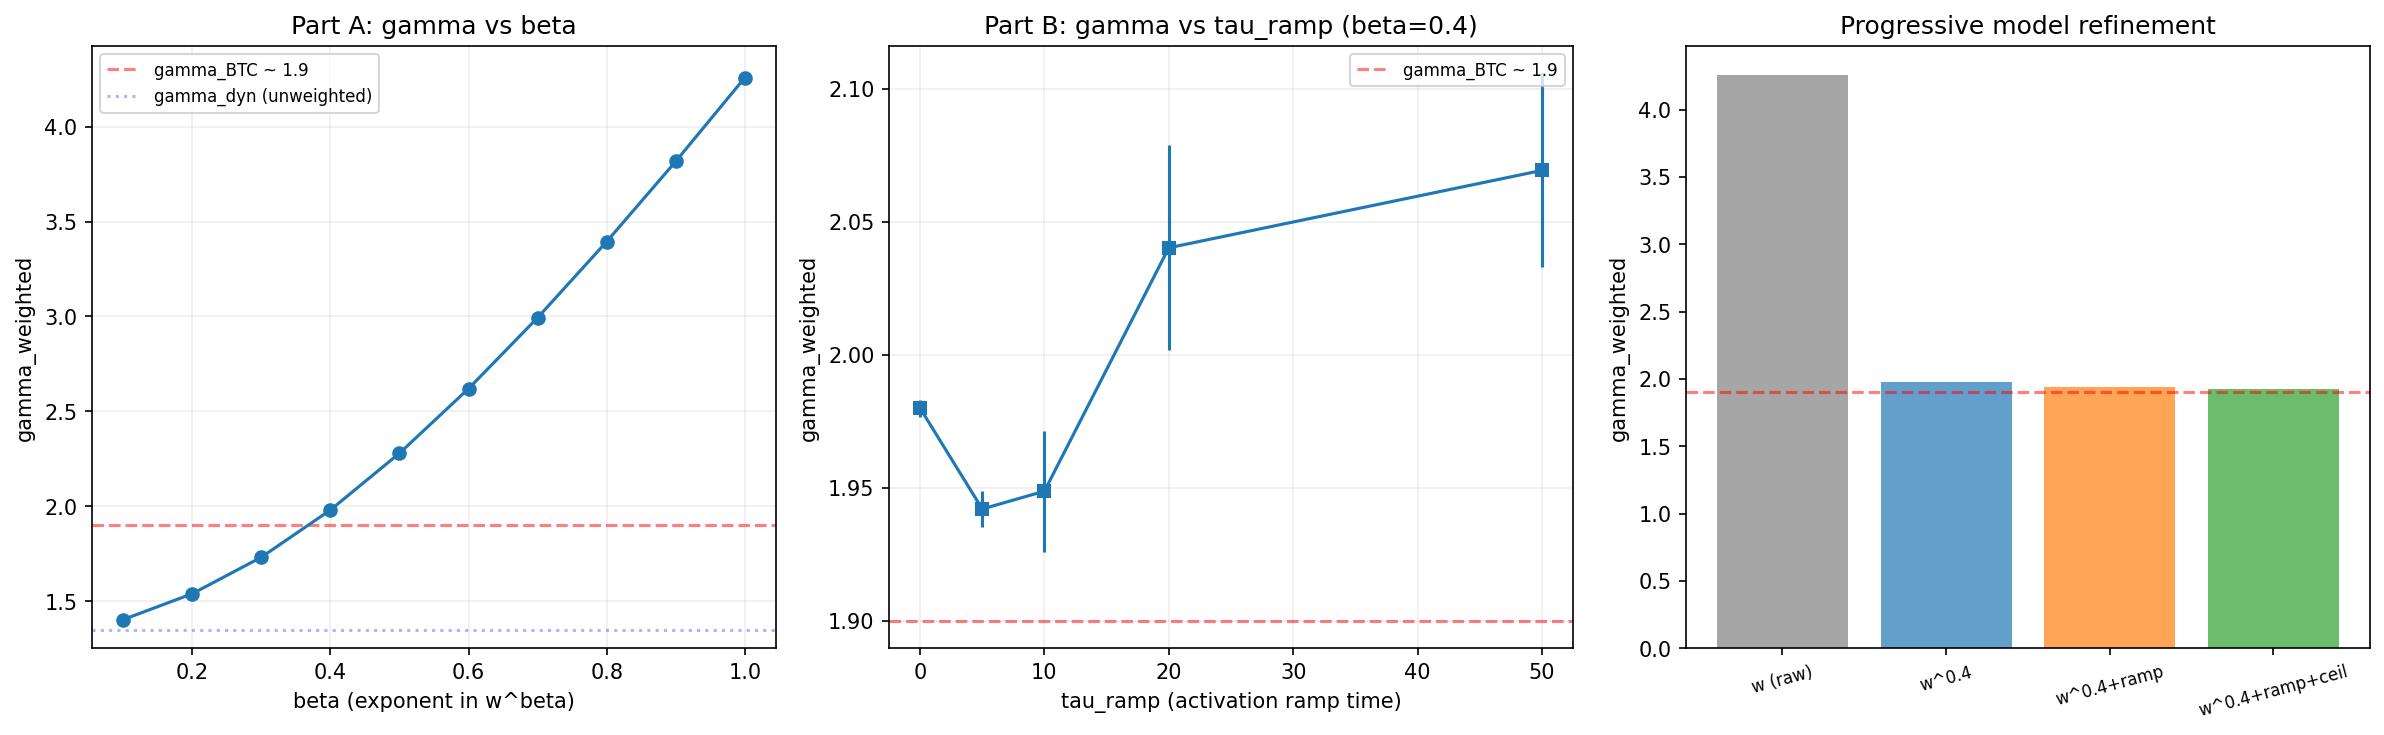
Sublinear value f(w) = w^beta figure
sim17 corroborative
Sublinear value f(w) = w^beta
beta = 0.4 brings gamma back to 1.93-1.98 with real Bitcoin weights.
Full calibrated model figure
sim18 corroborative
Full calibrated model
All mechanisms assembled: alpha = 3.03 and gamma = 2.01 simultaneously (product ratio 1.005).
Thermostat figure
sim19 corroborative
Thermostat
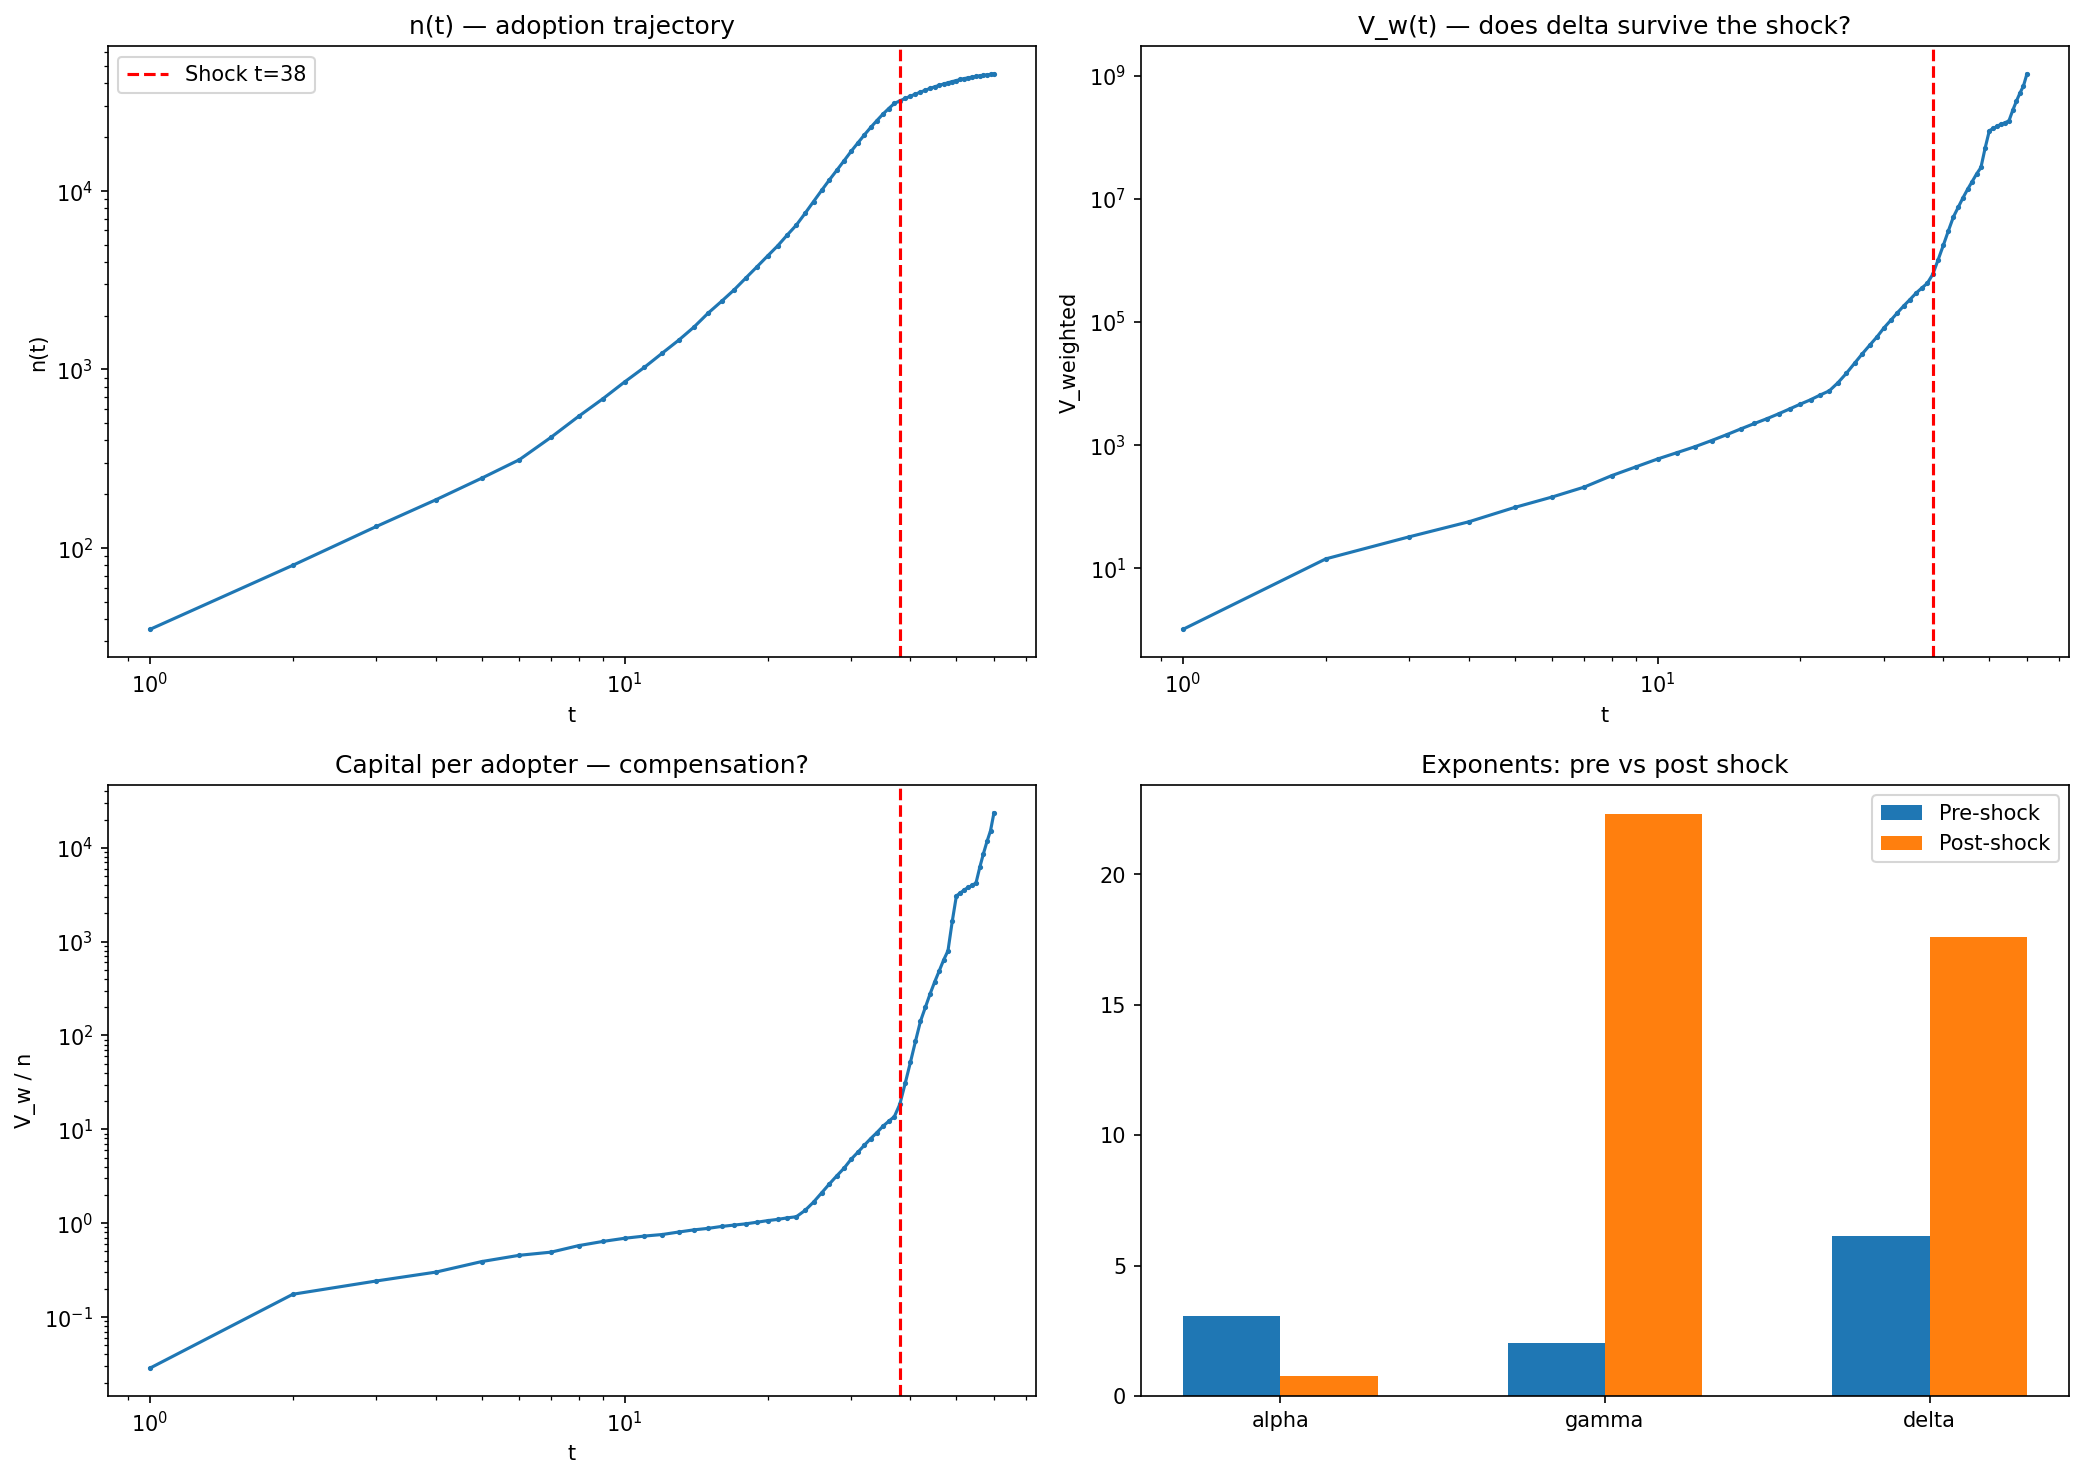
An adoption shock is compensated by value adjustment — the attractor mechanism in silico.
Pareto sweep figure
sim20 superseded
Pareto sweep
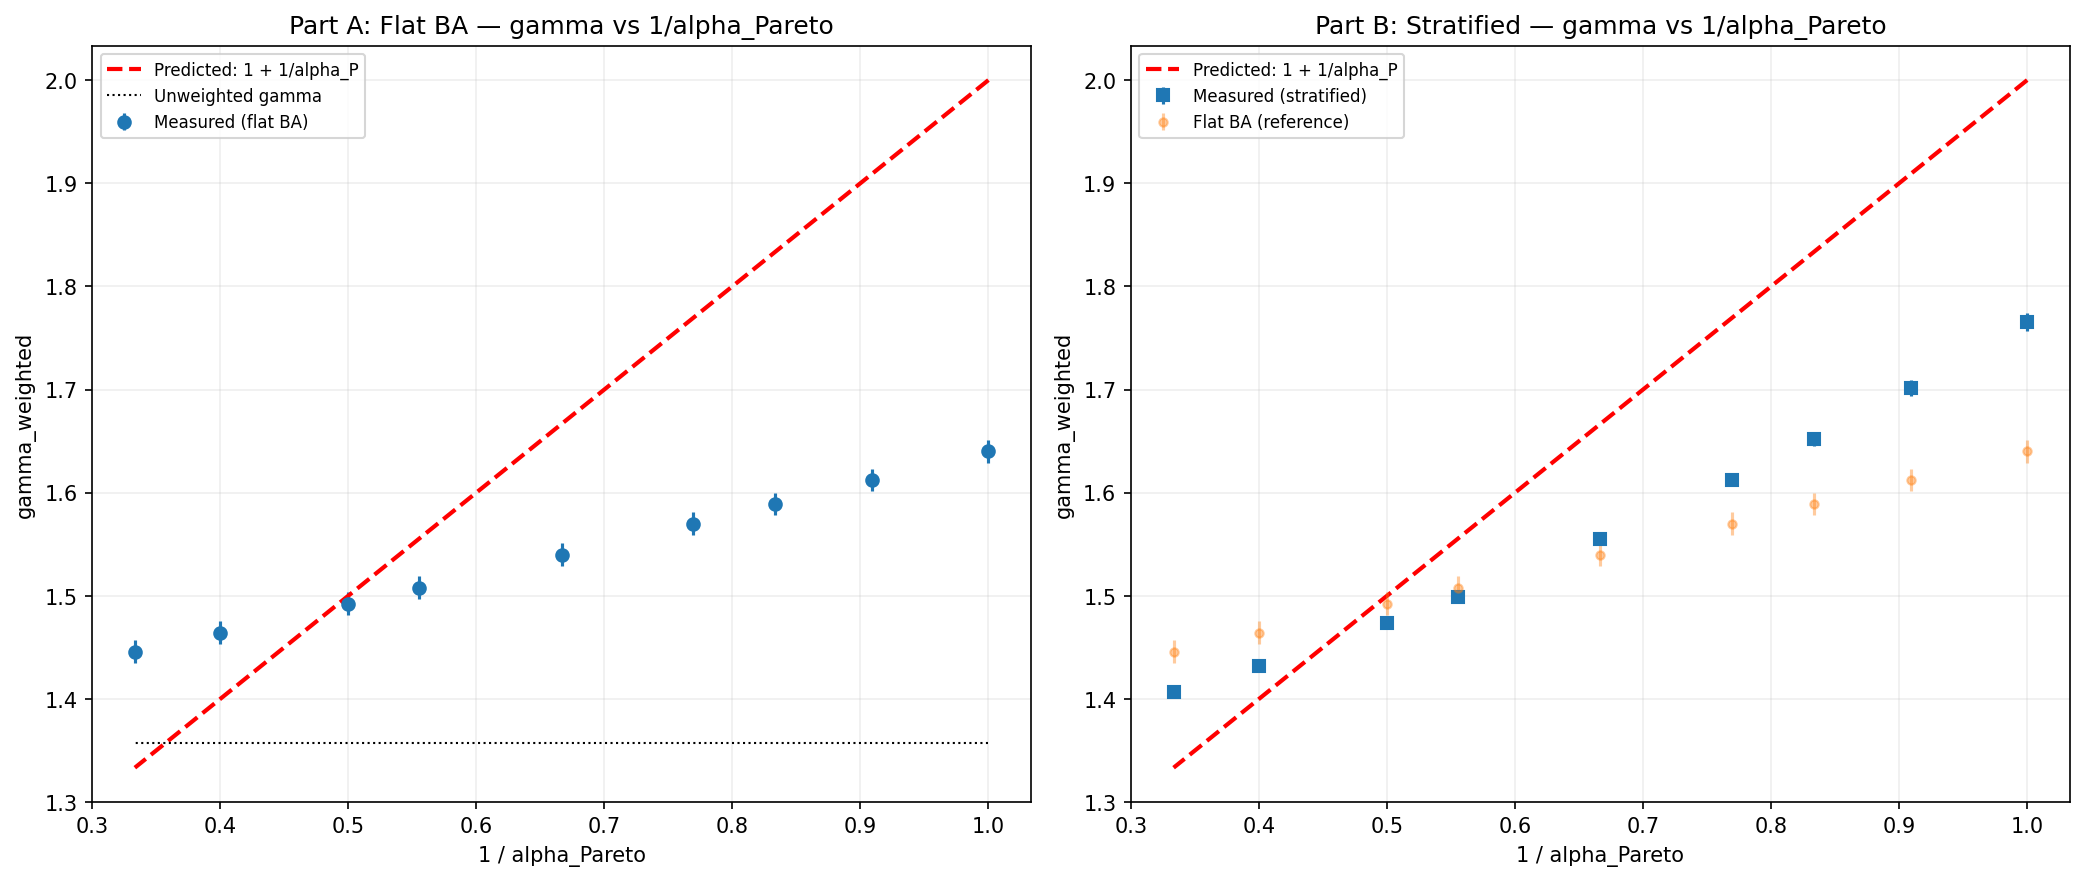
Once read as verifying gamma = 1 + 1/alpha; downgraded — sensitivity ~0.3 instead of 1.
Triple process figure
sim21 corroborative
Triple process
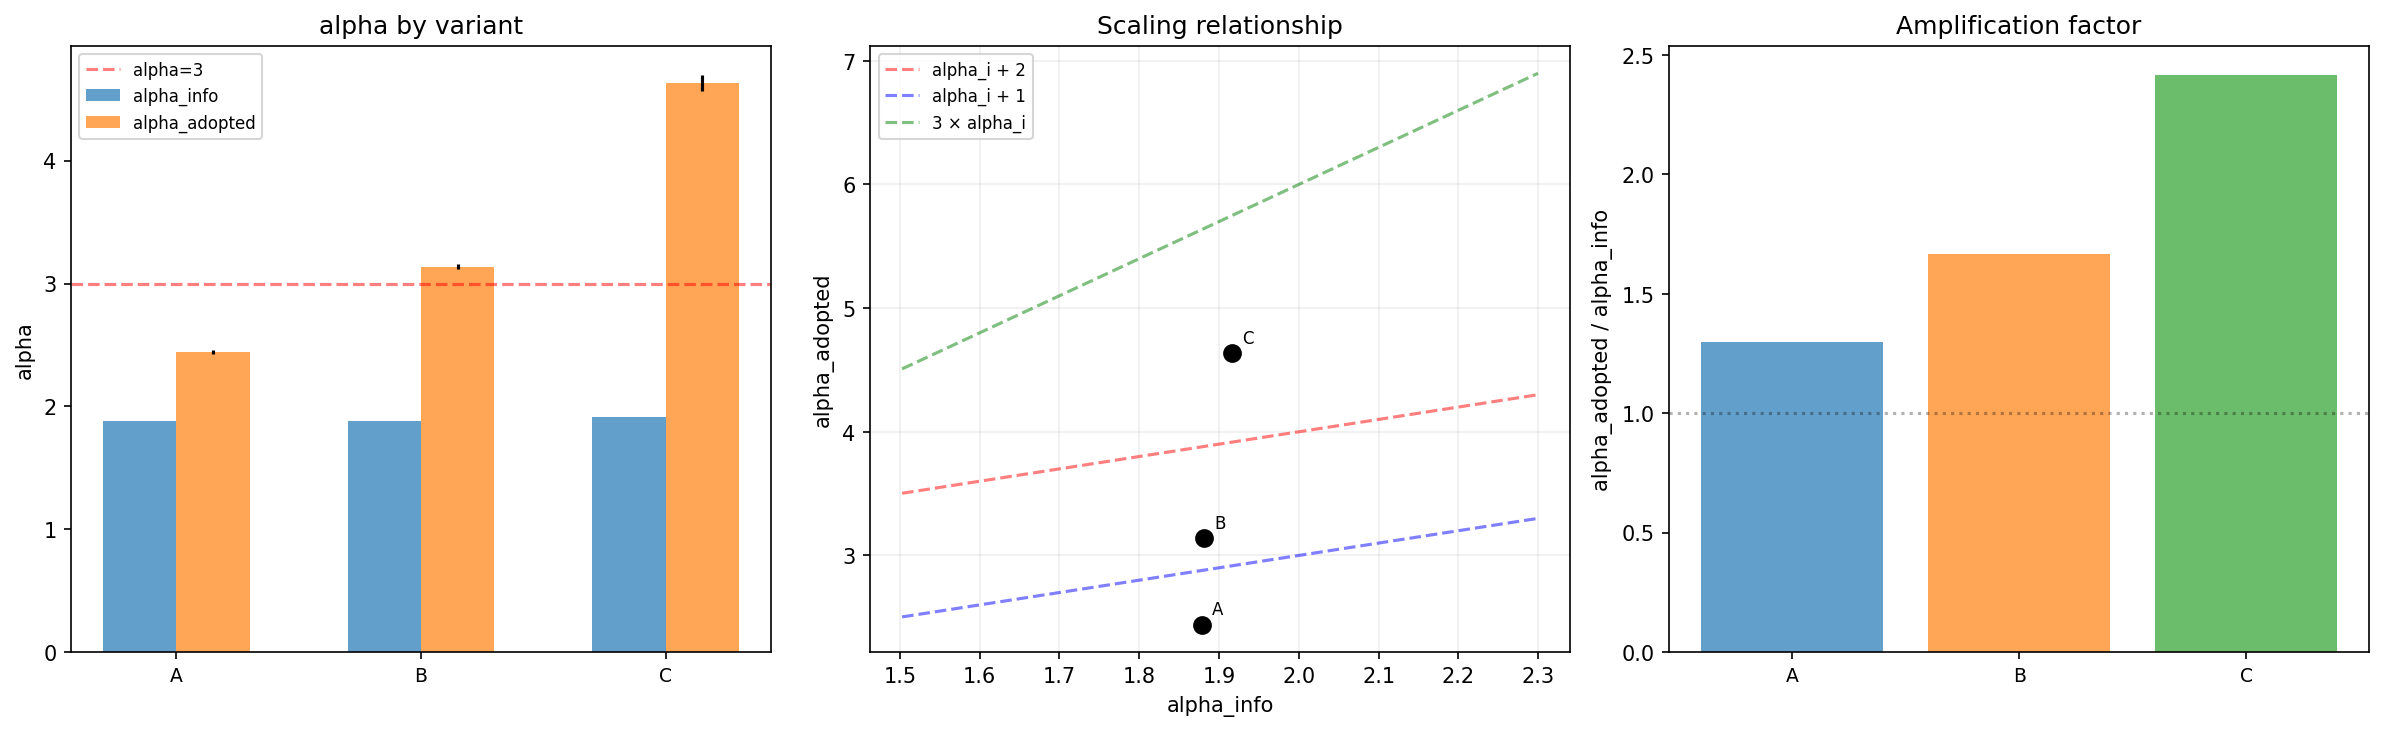
Three coupled ~t processes compose to alpha = 3 (variant B: 3.14).